Friday, September 28, 2018

Solar Index Correction Method for Sextant Sights

This is a specialized technique in cel nav that is only needed when pursuing sights to their ultimate accuracy. It is on the exponential end of gaining an extra small bit of accuracy at a fairly high price in effort. On the other hand, with a systematic approach to the measurement and to the special tools required, it could be more widely used, with a corresponding rise in cel nav performance.
Modern celestial navigation was well underway by the end of the 18th century.  Almanacs were readily available and numerous mathematical prescriptions for doing the analysis of several sights were widely known. Newton's original invention of the sextant had pretty much replaced all earlier measuring devices, and there were several well known textbooks on navigation. A primary reference from that era was Nevil Maskelyne's Tables Requisite to be used with the Nautical Ephemeris for Finding the Latitude and Longitude at Sea.  The first edition was 1766. We have at Starpath an original of the 3rd ed from 1802. That edition is also online as a PDF.  It is mostly tables, but there is a short section we care about now called the "General Introduction Concerning Instruments and Observations," which is at the back of the book!

This note is essentially a reiteration of part of that Introduction on how to measure a sextant's index correction using the sun. It is no surprise that there is not much to add. Other than bringing it to light for those who have not tried it, we outline our proposed procedure and describe our work form to compile the results. This topic (and motivation for this note) came up in our online classroom discussion as we go to press with a full set of our Starpath Celestial Navigation Work Forms, which includes detailed instructions and worked examples. But this particular operation and form calls for more background than needed for the other forms, because it is the rare instance where celestial navigation can be dangerous! Our Forms booklet outlines the basics of this process, and then refers readers to this note where we fill in the background.

I will outline our procedure and show our form for this and follow up with the actual wording in the Tables Requisite to show that none of the key principles have changed. In the process we discuss the sight taking and how to build a custom sun filter for this measurement.

First a reminder of what we are after. For the sextant to read the proper angle, the two mirrors, index and horizon, must be strictly parallel when the sextant reads 0º 0'. The sextant comes with ways to adjust both mirrors to accomplish this, but rarely, if ever,  is it justified to try to get these set just right, because after each adjustment we must do multiple careful tests to confirm it, and the adjustments are interlinked. One adjustment screw moves the mirror mostly one way (think of it as a vessel motion roll), but at the same time also moves it a little bit the other way (which can be thought of as a vessel yaw); the other adjustment screw does just the opposite. In short, there is cross talk in these adjustments.  The best procedure is to do the best we can to get it very close with reasonable effort, and then stop, and spend the rest of our allotted time on this to carefully measure how much it is off.  Then we just correct each subsequent sextant sight for that amount. The offset is called the index error; the correction for it is called the index correction (IC). The terms are often used interchangeably, but technically they would have opposite signs... which is confusing, and we don't want confusion, so we stick with the concept of IC.

The standard way to measure the IC is to set the sextant dials to 0º 0' and then look at any distant object through the telescope. When underway, we usually look at the sea horizon, which will appear slightly split (when there is an IC needed) at the intersection of the horizon mirror (the reflected view) and horizon glass (the direct view). We then adjust the micrometer until two views of the horizon are aligned, which implies the two mirrors are now exactly parallel, and then read the dial. If we get a small reading such as 2' then this is called "On the scale," or just "2' On."  In other words, this sextant read an angle when there was none, so we have to subtract that amount (the IC) from all future sights—it is like a speedometer on a car that reads 2 mph when you are parked. When moving that speedometer will read 2 mph too high.

On the other hand, if the sea horizon alignment brought the index to the other side of 0' we would read something like 58', and then we know we are 2' "Off the scale," so our instrument will read 2' too low on future sights. All celestial navigators know the jingle on how to make the correction:  "If it is off, put it on; if on, take it off," because we do not want to gamble with ± signs for such an important correction. Below is a reminder of how these readings appear on the micrometer drum.


Figure 1. IC measurements. Left reads Hs = 0º 2.0', which is IC = 2.0' On.  Left reads Hs = 0º 58.0', which is equivalent to  Hs = – 0º 2.0' corresponding to IC = 2.0' Off.  A counterclockwise (CCW) turn of the dial is in the direction of larger numbers on the micrometer, which in the telescope view brings the reflected objects down relative to directly viewed objects.  We call this CCW direction "Away" as we are turning the top of the dial away from us.


The topic at hand is the reference object we use to align the mirrors. Instead of the sea horizon, it could be a star or planet, or it could be a limb of the moon. What is not often noted is that it could in many circumstances be a cloud.  The alignment of any of these objects (sea horizon, star, planet, moon, or cloud, or a hilltop, a couple miles off) will indeed get us a measure of the IC, but it is not as accurate as we can do by using the sun. The sun is, frankly, the most trouble to use, but it does get the most accurate results.

"...the sun is incomparably the best object for this purpose."
—Nevil Maskelyne, 1766

Furthermore, none of these other objects gives us any direct measure of the accuracy of our IC measurement, whereas using the sun does indeed give us a check on our measurement. We can use this method to measure the sun's vertical width, which in turn we can look up in the Nautical Almanac—it varies slowly throughout the year.

The sun yields the most accurate IC, but we need very special care in the use of sextant shades or custom filters to be certain we do not get any direct look or even a glance at the sun during the process. That is the dangerous part of this technique, and probably why we do not often see this in modern textbooks or classroom courses. Even with the proper shades and filters discussed below, there can be fatigue to the eyes when applying this method, because we have to look toward the bright part of the sky frequently in order to know where to point the sextant.

Below we have a schematic presentation of the principle of what we are doing, then we look at the details of the actual measurement.


Figure 2. Schematic of a solar IC measurement. The round sun is stylized to be square so we can concentrate on the top and bottom edges. Direct view through horizon glass on the left is white; the reflected view in the horizon mirror is gray. This schematic has the suns offset horizontally, corresponding to a large side error. In practice they would be overlapped. Keeping the direct view on the left centered in the telescope, as we increase the value of Hs on the dial it brings the reflected sun down in this view relative to the direct view.

Steps 1 and 2 depict a "normal" IC measurement. With the sextant set to 0º 0', a first look shows the misalignment when an IC is needed. Bring them together turning the dial in whichever direction is needed, and then read it when aligned. The top of Step 1 would yield an IC On the scale; the bottom view would yield an IC Off the scale.  Let's say our true IC is 1.6' On the scale. We might not get exactly that in Step 2, because it is not easy to judge exact overlap of two disks—keeping in mind that in the telescope view the suns are inline, not side by side as shown in Figure 2.

A better approach is the crux of this solar method. Namely we measure the vertical diameter of the reflected sun—just as we would measure the height of a star above the horizon—using first the bottom edge of the direct view sun as a horizon reference and then again using the top edge of the direct sun as the reference. This gives us two measurements of the diameter of the sun, each of which depends on the value of the IC and the sun's semidiameter (SD). With two equations and two unknowns, we can solve for both, and use the value of the SD in the Almanac as a quality check on the results.

We first use the lower limb of the direct view for a reference (Step 3), and then the upper limb (Step 4). This will give us what we call an "on scale width" and an "off scale width"—names recommended by Maskelyne in 1766.  To consider actual values we would measure and record in the form, let us assume we have an IC of 1.6' On the scale and that the SD of the sun at the moment is 16.2', which is a typical value in the range of 15.7 to 16.4.

Looking at Step 3, we started 0º 0' in Step 1, we turned the dial to bigger numbers stopping at 0º 1.6' at alignment. Then we continue to bring the reflected view down by the full width of the sun (32.4'). When the top of the reflected view is aligned with the bottom of the direct view, the dial will read Hs = 34.0' (32.4 + 1.6). This reading Hs (on) = 2*SD + IC. This we call the On value of the width of the sun, which we enter in a form later.

Step 4. Now turn the dial the other direction, which moves the reflected sun up in the telescope view. This will be a rotation in the direction of smaller numbers on the dial. As we continue, we cross back over the view of Step 2 (Hs = 1.6') and then we keep rotating toward lower numbers till we are at the Step 1 view, which will be 0.0' on the dial. To align the LL we just have to rotate backward from 0.0 by an amount (32.4 - 1.6), or 30.8'. This puts us 30.8' behind 0.0', which we read on the dial as 29.2' because the dial counts backwards in the off-scale direction.  In our forms, we will record the off value as 29.2 then subtract it from 60 to get Hs (off), the Off value of the width of the sun, and record it in the form. In this case, Hs (off) = 30.8' = 2*SD - IC.


Figure 2a. Dial readings for Hs On and Hs Off for the sun width measurements.


We now have two equations and two unknowns we can solve.

           Hs (on):   34.0' = 2*SD + IC
           Hs (off):  30.8' = 2*SD - IC

Subtract the equations to get: (34.0' - 30.8') = 2*IC, or IC = 3.2/2 = +1.6, which is on the scale. Then add the equations to get: (34.0' + 30.8') = 4*SD, or SD = 64.8/4 = 16.2'. This arithmetic is worked in the form below.

That is the principle of the measurement that leads to the design of our form for the process. The best practice, as recommended in 1766, is to do this several times and then average the results.

In our proposed method, we add one more level of organization to the measurement, which comes from our extensive work with plastic sextants. That work has shown us that the IC you measure, depends on the direction you approach the alignment from. This is a much bigger effect in plastic sextants than in a good metal sextant, but even the best metal sextant will show this effect to some degree. In plastic sextants such as the Mark 15, there is notable slack in the gears. There is much less of this in a metal sextant, but you can, for example, still often align the horizon and stop, and then make a very slight turn of the dial before you decide it is no longer as well aligned.  Or align it, then see how much you can turn the dial before you note it is unaligned.

This is not just a mechanical issue, it is also related to our human interpretation of alignment. This varies between our perception of two images coming apart compared to two images coming together.  Thus we recommend measuring IC in both directions. In Step 3 we rotated counterclockwise till they came apart and Step 4 we rotated clockwise until they came apart. That illustrates the principle, but not the way we recommend doing it. We want to turn the dial in the same direction for the on and off values of the alignment.  In Step 3 we want to overshoot the alignment when bringing the reflected image down, and then turn the other way to align at the bottom and then top of the direct view going the same direction.

Each navigator needs to develop a way to keep track of which way they are turning the dials. What I have found useful is to think of a counterclockwise rotation to the left as "away" from me, thinking of the numbers on the top of the dial rotating away from me as I hold the sextant when reading the dials. This rotation increases the dial reading as the reflected sun moves down the view in the telescope.

With the same reasoning, I think of the other direction as "toward" me. This is in the direction of smaller numbers, with the reflected view rising in the telescope. This is clearly personalized terminology, but it helps me remember when I am turning "away," Hs is getting bigger, and the reflected sun is moving down. Others could be happier with just CW and CCW.

A first attempt at the measurement makes it very clear we have to be organized. We are turning a dial right or left, but it is backwards to us as we turn it. The motion of the sun we see is the result of a double reflection so when the numbers get bigger the moving sun is getting lower, and we are trying to keep track of its position relative to the other sun, which in principle is not moving, but the location of both of them in our view is totally controlled by very slight motions of the sextant as a whole (pitch, yaw, and roll)—not to mention that the suns are essentially the same color, and what we see at any moment would look identical to us if we did in the other direction! Pause or lose concentration for any reason, and we are lost—and must start again.  Indeed, we have to know what it means to "start again."  It should be no surprise that we strive to impose some order on the process.

Figure 3. Sequence of sights in a solar IC measurement. The gray sun represents the reflected view that moves with the dial rotations, although viewed through the proper filter these suns have essentially the same color. 

In Figure 3 the sights start in position #1, which is what we see with the sextant set to near 0º 0' looking toward the sun (all filters in place.) We begin with Away rotations till the suns are well separated as in #4, then we start up with a toward rotation, slow and smooth till #7 and then read and record the Hs on value.  Then keep going up till #9 and record the Hs off value. These are then called the "toward" values.

Next we repeat as in the bottom picture to get the "away" values, and these are recorded in the form and repeated several times as shown below.

Figure 4. Starpath Form 109, for solar IC measurements, designed by Lanny Petijean. His data here are using an Astra IIIB sextant, which was subsequently used for multiple position fixes on land to within 0.4 nmi as well as lunar distances accurate to within 30s. 

We see from these measurements the range of variation that is observed, even in the hands of an experienced user.  I must stress again that this method is not part of standard cel nav; it is a way to enhance the accuracy of sextant sights some fraction of an arc minute. I did two complete ocean passages in the 1980s by cel nav exclusively, and had never heard of this method at the time. Other factors such as good DR and logbook records are much more important for ocean navigation. On the other hand, attempts at accurate lunar distance measurements on land, should start with this method to measure the IC.

The sights are easier when the sun is lower, because we are looking more ahead than up, and the brightness diminishes with height as well, but there is a practical lower limit. An important part of this method is the check we get by measuring the SD of the sun, because we can look that up in the Nautical Almanac.  If they agree we have more confidence in our data.  In that comparison we make a tacit assumption that the refraction correction is the same for light coming from the top and bottom of the sun, which is perfectly valid for higher sights.

Refraction, however, changes rapidly for low sun or star heights. At Hs = 5º 0'.0 the correction is -9.9' but at Hs = 5º 32.0' (the other side of the sun) the correction is -9.1'. In other words, if we did our IC measurement with the sun 5º above the horizon, even with perfect sights we would this discrepancy of 0.8' confusing our analysis in some complex way. This discrepancy drops to 0.2' at Hs = 10º and is gone above 20º, so the practical lower limit  on this method to avoid that confusion is about 20º, which is about a handwidth above the horizon.

Sextant Sun Shades and Custom Filters

All sextants have two sets of shades, the main ones used for all sun sights called the index shades,  that cover the index mirror, and another set of usually much thinner shades called the horizon shades that cover the horizon glass, in direct line with the telescope.  These are intended for removing glare on the water, which is often an issue to deal with.  These horizon shades, however, are usually never thick enough to protect against a direct view of the sun as required in this measurement. I have seen sextants with a thick horizon shade likely intended for this purpose, but this is rare. Also we have a sextant with a pair of cross-polarized shades for both index and horizon (Figure 5).  These can in principle be set dark enough for this application, however...

...after using very many sextants of all types and price ranges, I have never seen a sextant that totally blocks out a view past the shades along one of their edges. This means that a standard sextant without a custom sun filter or eyepiece is not likely to be safe for this measurement.
In some older sextants we find an eyepiece cap that is thick like a welder's glass. These are presumably intended for these solar IC sights. You cannot see anything through them but the sun, and they go on the eyepiece end of the scope so both suns get shaded this way, resulting in two suns of the same color. Sometimes a colored sextant shade can be inserted that will alter the tone or color of one of the suns, which helps when possible.


Figure 5. A Tozaki sextant with several features oriented toward the solar IC measurement. The sextant shades are crossed polarized films, which rotate for varied shading.

This sextant does include the welder's shade eyepiece that fits over the main telescope, but even with this, we need an extra screen around telescope so we cannot inadvertently glance at the sun.  It is not just during the sight times we need protection; we must also lift the sextant and point to the sun, and that step also needs to be protected.

The 10 power scope is intended for IC measurements using the horizon, but this one also includes a welder's eyepiece, which must imply some optimistic thought on using it for the solar IC as well. This measurement is hard enough with a 4x40 or 7x35 scope; it takes a stronger arm and more patience than I have to succeed with the 10-power scope with its very small field of view.

The procedure for making a "Baader solar filter" for the end of the scope is given below.  Figure 6 shows one way to make a simple extra screen to prevent looking around the corner of the scope into the sun as you set up the sights.


Figure 6. "It may be sometimes convenient to provide an umbrella of pasteboard, about six inches square, with a hole in the middle to receive the telescope, in order to defend the eye from the direct light of the sun, as well as from the ambient brightness of the sky, which would otherwise render this practice in many cases too painful and difficult." —Nevil Maskelyne, 1766

It could be that telescope or camera stores have ready made filters that can be used on either the eyepiece or object side of the telescope for this purpose, but we have found it easy to construct our own that custom fits the various scopes we have, which vary from 7x35 on down to a Davis 2x20.  The procedure was first presented in our book How to Use Plastic Sextants: With Application to Metal Sextants and a Review of Sextant Piloting.

How to Make a Baader Sun Filter

The filter is named after the museum that originated the solar filter film we used. Alert: these films are expensive. See also links on related films as well as our earlier note on using your eclipse viewing sunshades for this—which is actually another approach, maybe even best. Make a pair of these that will stay securely in place, and do all the sights that way—short of reading the dials!

First check your sextant-telescope geometry so you know how much room you have. Generally the filter tube assembly must be made fairly thin to allow the index arm to move past it without hitting it.

Step 1. Wrap several strips of thin cardboard around the telescope, to form a small tube about 1” tall that just fits on your telescope. Glue these layers together to make the tube.
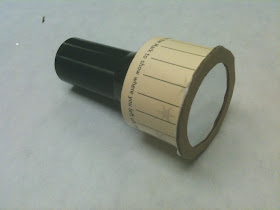


This shows the final filter, including how it started by wrapping layers around the telescope to get the right dimensions. We used our Smart Mark book marks for this, showing once again how smart they are. There is another finished filter shown in Figure 5.

Step 2. With the Baader foil between two thin cardboard or paper sheets mark the size of piece that will be needed to cover the tube and cut this out. Here we used card stock that was originally the cover of a booklet on weather.
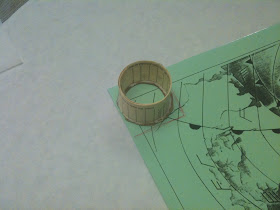


Step 3. Make two cardboard base plate rings that have inside and outside diameters just a few mm smaller and bigger than the diameter of your tube. The film will be secured between these.
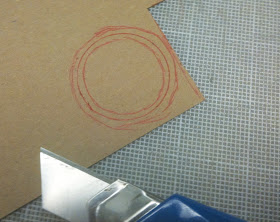
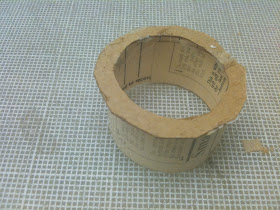


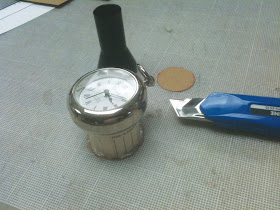
Step 4. Glue the tube to the center of one of the rings. Below we show a pocket watch being used as a weight as this glue dries. We used Gorilla glue, that dries white in 15 min or so.


Step 4. Put a trimmed layer of double-sided adhesive tape on the top of the ring. This will be used to hold the foil on the end.
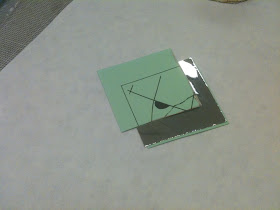
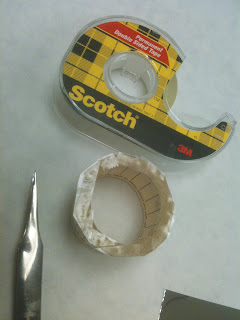


Step 5. Carefully place this adhesive side down onto the foil to stick it to the ring, then add the second ring on top of that using the same adhesive tape to protect the edges of the foil. Small wrinkles in the foil will not matter, but you can usually do this with very few wrinkles.

Step 6. Trim the edges of the rim as much as you can, and be sure that at least one orientation of the filter will allow the index arm to pass below it.

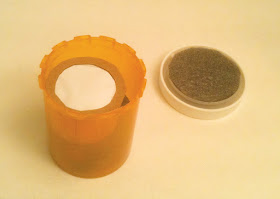
Step 7. Look for some fortuitous container that can serve for storage and protection. We found a plastic pill jar just right for this one, with a few pieces of foam inserted to hold it in place.


With one of these filters on the end of the telescope and one of the extra screens mounted around the body of the telescope you are protected during the process.


Original Tables Requisite Instructions


Here is a video illustration of how the suns look through a telescope with sun filter in place, along with a few other comments on the process.


The video failed to show what it looks like to rock the sextant, which is illustrated in the image below. The effect depends on the extent of side error, but we are assuming we remove side error for this measurement. Generally you can tell the vertical alignment of the suns rather easily. The main thing to catch is if they are not one on top of the other, then you need to rock (roll) the sextant to them in line.


Note that the alignment does change when they are not vertical.


Monday, September 24, 2018

Barometer Use at Higher Elevations

Normally we work with maritime applications of barometers at sea level. But some mariners live inland at higher elevations and take their quality barometer home when they leave the vessel. And there are, of course, many folks who are not mariners at all, but still care about accurate pressure, and they live inland at higher elevations.

For those at higher elevations the issue arises immediately that aneroid barometer dials cover a fixed range of pressures, but the atmospheric pressure decreases notably with elevation above sea level. The global average pressure of 1013 mb at sea level will drop to about 920 mb when the barometer is taken to an elevation of 2,600 ft (800 m). This pressure is not even on most aneroid dials, so they would not work at all. The failure is even worse when a low pressure system goes by.

When considering the purchase of a barometer for use at higher elevations we must look into the dial range relative to the intended elevation of use.  The table below shows how pressure changes with elevation. The correction is Po - Pa.

Properties of the standard atmosphere from Modern Marine Weather, 3rd ed.

This is still an approximation because this conversion depends somewhat on the outside air temperature if much different from the values listed, but that is a small effect in normal temperature variations. In fact, for many applications you can estimate the pressure drop with our jingle "Point four four per floor," which means the pressure drops by 0.44 mb for each 12 feet of elevation above sea level.  At a 240 ft elevation, the correction would be (240/12) x 0.44 = 8.8 mb.

The Fischer Precision Aneroid Barometer is a good example to look at because this instrument offers a custom version for higher elevations. The standard unit can be used for elevations from sea level to 2,600 ft (800m); the high-elevation model is intended for elevations from 2,600 ft to 6,500 ft (2,000 m). We can see how this plays out by looking at the dials and thinking over expected pressures. This is shown in the figure below.


Figure 1. Fischer Precision Barometer dials

You may have to zoom the image to see the values, but we have marked three pressures common to all barometer use: the global average sea level pressure (SLP) at 1013 mb, plus the high-end limit we might expect on land at 1050 mb SLP. Actual land records vary from the all time extreme of 1080 (SLP) or so in the Siberian High to pressures in the1050s representing land records across the US. At sea we can see periodically mid 40's, but very rarely ever high 40s.

The low end on land is equally nebulous as hurricanes do come ashore, but away from that possibility record deep Lows on land are on the order of 970 mb (SLP). So for land use, we would want our barometer to cover the range of about 970 to 1050 (SLP).

Once we take the barometer to sea, however, we can expect deeper Lows... not that we want to ever get that near to them. A typical central pressure for a medium to large hurricane can be about 920 mb as shown below.


Again, we are not doing any tactics with pressure once we get into that sort of low pressure, or anywhere near it, but we do want our barometer to read properly at the deep low end of the scale.  One crucial feature of the Fischer instruments is they are guaranteed to have an accuracy of ≤ 0.7 mb at all pressures shown on the dial. This is important because these instruments are used on Navy vessels that do periodically end up in very low pressures.

The result is that for a barometer used at sea, the required pressure range is much larger than on land. We have illustrated that schematically with the red and yellow extension of the land-based range. Notice that the standard dial actually goes much below what we would ever expect at sea; this extended range is there to cover use at elevations above sea level. Going back to the basics, our instrument at higher elevations reads station pressure, but we need to interpret that in terms of sea level pressure, because all weather reports and weather maps use SLP.

Once we go to higher elevations, we are moving farther away from the coast where the likelihood of measuring hurricane pressures diminishes greatly. This is something that each user can judge from their regional history.

The top right side of Figure 1 shows a standard dial used at the upper limit of its elevation. We see that the active part of the dial (the yellow arc) is now on the bottom of the dial, but all expected atmospheric pressures are covered with equal accuracy.  This active range marked in yellow is what establishes the upper limit of elevations (2,600 ft) for the standard model.

Above 2,600 ft, the high-elevation version is needed, and that dial is shown in the bottom of Figure 1. The left side shows the lower elevation limit and the right shows the upper elevation limit.  Over the full elevation range, we see the active part of the dial change from one side to the other, while an intermediate value would occupy the center part of the dial.  The key point to note is that the full range of expected atmospheric pressures would show within the instrument's dial and accuracy range.

Electronic Barometers

A logical question that might arise at this point is why not just use an electronic barometer for pressures at high elevations? They don't even have a dial, just digital pressure output. The answer is accuracy.  Electronic barometers must also be adjusted and calibrated during manufacture just as aneroids must. And like most common aneroids, common electronic barometers are typically adjusted to read accurate pressure in the mid range at sea level.

It is true that even a common electronic barometer, such as the ones we have in our cellphones that we access with a barometer app, will read more accurately at the very low pressures experienced at high elevations than will a common aneroid, but they still lose accuracy at the very high and very low ends. A cellphone barometer, and indeed many electronic barometers that cost less than $2,500, could be off as much as 2 mb at 760 mb if they were exactly right at 1013 mb.  (The value $2,500 is not a random number; it is the cost of two popular laboratory instruments that indeed provide their guaranteed high accuracy over their full valid ranges.)

Since we are not going to know how any random barometer will actually behave in extreme pressures when we buy it, we have to rely on the published accuracy, reputation, and history of the instrument. We also do not want to be misled by "pressure precision" or "pressure change sensitivity" or "relative pressure" specifications listed under an accuracy specification. The cheapest electronic barometer is good at these. Likewise, even "sensor" accuracy is not a guarantee, because these sensors have to be soldered and incorporated into a circuit, all of which sensitively affects the final output accuracy. In short, we have to get to a pretty high price tag on an electronic unit to get guaranteed pressure accuracy specifications over a specified broad range of pressures.

Even compared to fairly expensive electronic barometers, it is difficult to beat the Fischer Precision Aneroid Barometer's guaranteed accuracy ≤ 0.7 mb over all pressures shown on the dials of both low and high-elevation models* After ten years of use at sea, there is no competition at all—which incidentally makes cellphones a good choice for an electronic barometer, because we are going to replace them in any event in this period!  A cellphone is very convenient for daily pressure work, with a quality aneroid in constant view to check it with.

* It is important to recognize that all barometers, aneroid and electronic, drift over some period of time, so they must be compared with a reliable source and set to the right pressure if needed. For a high-quality barometer, aneroid or electronic, this process of setting the instrument is not affecting or related to its calibration over the full pressure range; it is just moving the full calibration curve up or down a small amount. We recommend that all barometers be checked this way once a year—although we have seen some Fischer instruments and laboratory-grade electronic instruments not budge over 5 years.

Footnote:
If you look at the top of the standard dial in Figure 1, and indeed look at most brands of aneroid barometers (especially in the US and UK), you see the pressure of 1000 mb is at the center of the dial, whereas it is globally known that the average pressure is 1013 mb, which is well off to the right. We tracked down this mystery in our Barometer Handbook. By long established convention, these barometer dials are centered for an elevation of 365 ft, which happens to be the average elevation of England, where much of the early aneroid development and production occurred. This put their average pressure at the top of the dial. On the other hand, looking to more modern dials from some European makers, you will see 1010 or 1015 centered at the top of the dial.


Sunday, September 16, 2018

Using Buoy Data and BuoyCAMs to Study Passing Storms, Part 1


When we learned that Hurricane Florence was headed toward NDBC BuoyCAM 41049, we set up a convenient graphic way to monitor the relative positions of storms to this and other buoys in its track so we could know when to look at the pictures.  The pictures update every hour, so we need to catch them at the right time to learn what we can.

Finally a working system emerged to view all the BuoyCAMs in the form of a KML file that loads into Google Earth (GE) superimposed onto the NHC storm track chart that automatically updated every hour.  We even eventually got it working in smart phones. Then when all was in place and working, sure enough, Florence went by Buoy 41049 in the middle of the night when the cameras could not see it!

For those unfamiliar with the BuoyCAM program, here is a short video overview.


Missing the storm's closest point of approach was a disappointment, but not the end of the world.  The storm had to approach several more data buoys and one more BouyCAM on the way to the coast, and we could try again, which we did.  Also this whole study is primarily to prepare for other systems that will come by later in the season.

I have yet to write up the actual science (marine weather and navigation) that we might glean from these observations; for now we are just getting the tools in place.  Much of the background is covered in our new book Modern Marine Weather, 3rd ed, but I will add focused notes on the observations, once we get more data.  In short, we want to study conditions on the edges of these systems when we still have time to maneuver around them. So we are looking at pressure, wind speed and direction, and sea state when available. With the BuoyCAMs, there is the hope that we can learn about the sea state and approaching cloud patterns.

In each case, we need to correlate the data we see with the actual range and bearing to the storm at the time of observation, which we get from other sources. For tropical cyclones in the Atlantic and Eastern Pacific we will get this from the NHC.  There is only one BuoyCAM near HI, which could see storms coming up from the SE, in which case we go to the CPHC for that data. We have two Atlantic cases to look at below to see what we might learn.

First there is the issue of what exactly are we looking at in the pictures? Each BuoyCAM has 6 cameras on it dividing the horizon into 6 segments, 60º across. The one on the left has a true direction label on it. The location of that direction within the frame has no significance. We can think of it as the approximate direction of that camera.  Below is how we concluded that based on measured bearings to known sunrise directions.

For each of these cameras, we used their Lat-Lon that we get from NDBC and the UTC of the picture to then go to the USNO website to compute the precise true bearing to the sun. Then this fixed scale was placed on the image sequence to locate the bearing of the left-side camera. In each set, the white arrow and number points to the direction of the labeled bearing.

The conclusion is that the bearing shown marks the general direction of that camera, but not precisely. The bottom 3 were all close, within about ± 15º, but the top one was off 30º. We have since improved our method of scaling these pictures (shown below) and indeed our new system seems to have found a buoy whose camera was stuck on the wrong direction. But in looking at very many of these, that is the only one we found off. This was reported to NDBC, they confirmed our observation, and it is on the list now to be repaired on the next maintenance voyage.

Now we can look at the sequence observed as Florence approached BuoyCAM 41049 so you can see what the sequence looks like, with no adjustments. The top is most recent, after the storm went by; the bottom is the previous day.


We notice the seas were rough at sunrise after it went by—the surface slope we see in the right-hand pictures at sunrise 0510 AST, Sept 11, are waves, not the horizon viewed from a tilted camera—but we do not see much interesting in the clouds before or after... at least without further manipulation. If the BuoyCAM is under a band of squalls it seems to block out any definition of the storm cell or wall cloud itself.  At the time this storm passed the buoy (06 to 09z on Sept 11) it was a hurricane with sustained winds of 125 kts, gusting to 150. The center of the storm was 107 nmi off in direction 148T.  At the location of the buoy the winds were 35 kts gusting to 45. We don't have much info yet, but for a storm of this size, every mile you get from its center helps. Here the 150 kts along the eye wall dropped to 35 kts at 107 nmi off, which is a good place to remind mariners to review the 'Mariners 1-2-3 Rule" and the "34-kt Rule," which are explained starting on page 44 of indispensable Mariner’s Guide For Hurricane Awareness In The North Atlantic Basin

After the storm passed this buoy, it then approached another BuoyCAM, 41004. The raw data are shown below, again most recent at the top, then preceding hours below.


This is the one we ran across the camera problem.  In the forth one down from the top (valid at 1410z), we can see clear indication of the sun direction. We know the location and time, so we can compute that the sun was 38º above the horizon at that time, in direction 115 T.  The sun bearing on that scale would be about 231 + 60 = 291, which is north of west at a local time of about 10 AM.

We also noted that the 231 label for the left camera had not changed all day, whereas these typically swing around with the wind—they are on a buoy, on a chain.  We contacted NDBC to ask about this to learn that it is now on a maintenance schedule, but it could be a while before they get to it. These buoys are not like satellites that can be remotely controlled and even repaired. A real ship has to go there and real people have to fix it.  We have looked at a lot of these images from many buoys, and this is the first one we found with this error. If you want to be sure your scale is right, then it is safest to check the buoy at sunrise or sunset and compare to the true sun bearing at the time. Here is a video on how to check BuoyCAM bearings, which includes a way to get archived images, which is not documented elsewhere... sorry that it is a bit long (18m) to go over these details that might not be of interest to all readers.

How to download BuoyCAM images, present and archived, and then how to add a scale to them using a Mac. A PC version will be added shortly—the process is the same, it is just the graphics viewer programs that are different.  The overlay file needed can be downloaded at 


For the time being, we ignore the posted direction label shown and scale them to match the known sun direction at 1410z. We have also aligned the pictures and added a full scale, as explained in the video above.
With this view (using the corrected scale) we do not immediately see any localization of the storm, but we do see notable clear weather to the S-SW at 1510 and 1610z.  We can check that observation with a satellite image of the storm, the closest in time we have being at 1647z, shown below.


This is consistent with the BuoyCAM (showing clear to the SW at this time) and does show that we can, on some level, imagine the mariner's perspective from the buoy. Keep in mind as well that this is dynamic. A few hours earlier this would not be the case, which is also reflected in the pics. The storm was moving W-SW at just 3 kts, but the clouds (squalls) were rotating counterclockwise.

More to the point, the storm center is to the NE at 15 to 16z.  To get better perspective on that, we recenter the series of pictures above to get the following views.br />


Now we get a better feeling of what mariners might see looking around the horizon. Not only would they see clear skies to the SW, on the other side of the horizon they would see an ominous cloud to the N-NE, which we can only guess would be more impressive if we had a higher camera view.  We get the best view of this at 1510z. Zooming in on 1510z, you can see under the clouds to a more prominent barrier. The center of the system was 110 nmi off at this point, and the eye diameter of this now strong tropical storm was 15 nmi.

This is some form of a "bar cloud," which can be watched to monitor its relative direction of motion.  If it just grows bigger and keeps coming from that direction, the storm is headed toward us. If it moves to one side or the other, it could be going by to the side. That type of observation depends on the squalls, which come in bands, spiraling around the strom, and these could obliterate any such detailed observations.  Hopefully as we get more image data in these conditions we can learn more about that type of observation.

In preparation to looking to the actual Buoy data rather than just the images, here is the full NHC Advisory 61 description issued at 9/15 at 1500z:

HURRICANE CENTER LOCATED NEAR 34.0N  78.0W AT 14/1500Z
POSITION ACCURATE WITHIN  10 NM

PRESENT MOVEMENT TOWARD THE WEST-SOUTHWEST OR 245 DEGREES AT   3 KT

ESTIMATED MINIMUM CENTRAL PRESSURE  958 MB
EYE DIAMETER  15 NM

MAX SUSTAINED WINDS  70 KT WITH GUSTS TO  85 KT.

    64 KT....... 60NE  60SE  60SW  20NW.
    50 KT.......100NE  80SE  80SW  40NW.
    34 KT.......170NE 150SE 140SW  80NW.

12 FT SEAS..330NE 240SE 120SW   0NW.

WINDS AND SEAS VARY GREATLY IN EACH QUADRANT.  RADII IN NAUTICAL
MILES ARE THE LARGEST RADII EXPECTED ANYWHERE IN THAT QUADRANT.

The buoy at this time is 110 nmi SW of storm center, which means the forecasted winds were 34 kt, a forecast that extended out to 140 nmi in this quadrant according to the Advisory. The actual winds were a bit less, 25 to 27, gusting to 35, but well within the expected variance, as clearly warned.


The above notes outline the type of study we can do watching the buoys as storms pass by. The NDBC has a series of these studies archived, which teach us much about real observations in the vicinity of tropical cyclones. Here is one of their examples showing Hurricane Rita passing over several buoys. We have used that data to confirm our "generic hurricane" we use in our textbook, Modern Marine Weather, 3rd ed. The archived NDBC results, and our own meager beginnings here on use of BuoyCAMs, are very encouraging, so we will continue to work on ways to learn more from the data.

BuoyCAMs employ the NDBC's  SCOOP (Self-Contained Ocean Observing Payload) system of using several sensors in one modular unit. The images are then transferred from the buoys to NDBC via the Iridium RUDICS network. The program began in 2014/15 and is expanding still. We can look forward to even more informative images in the future as more BuoyCAMs go online with even better cameras. Think of what has happened recently with cell phone cameras to imagine the potential.

I conclude by admitting what has been in the back of my mind from the onset of our BuoyCAM studies: It is one particular picture we have had in all of our training materials, since first editions.


Figure 4.5-7. Photograph of Hurricane Klaus in 1984, courtesy of Charles Brown, who was taking part in NOAA’s Voluntary Observing Ship program at the time he took this photo, less than 200 nmi from the wall of the storm, uniquely visible in the picture centered over the headland on the left. On the right are several squalls. Notice how calm the water is at this distance off and how clear the sky. Klaus Lasted from Nov 5 to 13, with peak winds of 80 kts at 980 mb on Nov 9

In the past 34 years of looking, we have not found anything at all similar to this. But just like the gold miner who keeps going back to the hills, we keep looking. There is, of course, a lot more to find besides unique images like this one.
________________


This note is now called Part 1, because new methods became available in 2019, which led to a new Part 2, which expedites this process a bit. The above basics remain crucial to interpreting the BuoyCAM images.


Monday, September 3, 2018

Finding Longitude From the Time of Sunset

With accurate time available, there are several ways to find your Lat and Lon without a sextant if you ever lose GPS data. We cover each of these in the book Emergency Navigation. In this note we work through one example, which is just noting the time of sunrise or sunset. The principle behind this sunset method is easy enough to understand, but as we show here there are details to executing it, and a couple different approaches.

The measurement was kindly provided by meteorologist Angeline Pendergrass  during a research voyage on the RV Thomas G Thompson in the Strait of Juan de Fuca. She took the data from the aft deck at a height of eye estimated to be 10 ft above the water.

This type of sight requires seeing the top of the sun (upper limb, UL) disappear below the visible sea horizon. This observation is not quite as common as we might guess, even at sea. More often than not, there is a low layer of clouds on the horizon so we do not get to see a nice clean crossing of true sea horizon.

Since she did not have a watch at hand, the procedure was to take a cell phone picture of the sunset, just as the upper limb dropped below the visible horizon, which marked that time in her phone. Then she proceeded to the wheelhouse and took a picture of the GPS screen, which showed the UTC and the location of the vessel, which was drifting at the time. The cell phone time showed the delay was 1m 7s, so she could then figure an accurate time of sunset with the associated position.

The results were:
Sunset (upper limb crossing the visible horizon)
03:17:49  April 23, 2013 UTC
Lat 48º  16’  19.5493’’ N
Lon 123º  58’  57.5673’’  W
Height of eye 10 ft 
[I just found this article on my desktop, started 5 years ago, and finishing it now for our cel nav and emergency nav courses.]

Converting to decimal minutes, we will round this to 48º 16.3’ N, 123º 59’ W, which represents the true position of the vessel at the time of the sight.

We can solve the sunset method several ways. Some are easier in principle; others are faster to implement. We start with one that does not require any knowledge of celestial navigation, and follow it with a much faster method for those trained in cel nav.


SOLUTION 1. NAUTICAL ALMANAC SUNSET TABLES

We can find our Lon using Sunrise-Sunset Tables, but these tables come in several formats. A common type lists the times for the specific standard meridian (the longitude center of a time zone) of a specific place, using that specific time zone, such sunrise and set times for Seattle. Generalizing that type of table to our needs adds another layer of complexity to the process. Luckily, there are sunrise and set data in Tide Tables and the Nautical Almanac that are more generalized. These tables rely on the definition:

UTC sunset (Lat 1, Lon 1)  =  UTC sunset (Lat 1, Lon 0) + (Lon 1) x (1 hr/15º).

In words: the UTC (once called GMT) of sunset observed at (Lat 1, Lon1) is equal to the UTC of sunset at Lat 1 and Lon = 0 (Greenwich meridian) plus the time it takes the sunset to get to us as it moves west at a rate of 15º of Lon each hour.  (In East Lon, the last term is negative.)

We can rewrite that to solve for Lon:

Lon  = (15º/1 hr) x (UTC sunset observed – UTC sunset at Greenwich)

Our Lon is just the difference between observed sunset time and the sunset time at Greenwich at the same Lat converted to degrees at the rate of 1 hr = 15º, which means that 1 min = 15', and 4 sec = 1'

We observe the first term by timing the sunset, so the whole process boils down to looking up the time of sunset at Greenwich on the date and Lat of interest.

You can go online and ask for that time (http://aa.usno.navy.mil/data/docs/RS_OneDay.php) and you will get 1902 UTC for this example, which is given rounded to nearest whole minute, but assuming we do not have internet when we need to find our Lon, we have to use the standard tables, which always requires some interpolation, followed by the time-to-angle conversion. Sample USNO online screens are below. They also offer options to print out various tables.

Top is input page; bottom is output page from USNO site.

The virtue of using the sunrise sunset tables in the Nautical Almanac is they provide just what we want, namely the values of sunrise and sunset in UTC as observed at Greenwich.  Normally, the navigator has to then apply a Lon correction to learn what to expect at their location, but now we are working this backwards. Below is a sample of a full daily page of the Almanac with the sunrise/set data marked.


The Almanac lists only one set of sunrise/sunset data on each page that covers 3 days. The data given are always for the middle date, so we are lucky here in that we do not have to interpolate for the date. If we wanted this on Apr 22, we would have to interpolate between Apr 20 and Apr 23 before we interpolate for Lat. Since we have the right day in this case, we just need to interpolate for the Lat.

50º 00’ N 19:06

48º 16.33 N hh:mm

45º 00’ N 18:56

At this place and time of year, the sunset time increases with Lat by 10 min (1906 - 1856) per 5º of Lat (50 - 45).

We are 3º 16.33’ (3.27º) above 45º, so we find  sunset time at Greenwich at this Lat as:

hh:mm = 18h 56m +(10m/5º) x 3.27º = 18 56 + 6.54m = 18h 62.54m = 19h 02m 32s.

Our Lon is then ( 03h 17m 49s - 19h 02m 32s) converted to degrees.

This is a negative number, which might pose some confusion, but the solution in practice is easy; just add 24 hr. You can think of this (Figure below) as the time it takes the sunset to move west from 1902 to midnight (24:00:00 - 19:02:32) + time it takes to get to us from there (03:17:49 - 00:00:00).

Schematic depiction of the sunset moving west at the rate of 15º of Lon per hour.

Thus we have this sum to make of hr, min, and sec,  done as separate columns. The answer is our "Lon" is 8h 15m 19s, which we then convert to time at the rate of 1h = 15º, 1m = 15', and every 4s = 1'.


Thus the Lon we find from the time of sunset using sunset tables is 123º 50' W, which is to be compared to our actual location of 123º 59' W.

This is 9' of Lon wrong, which at 48 N corresponds to 6 nmi (9 x Cos48). This is well within the expected uncertainty of this sunset tables solution. The cel nav sight reduction in Solution 2 below is more accurate, but even using that method we have to accept an uncertainty of about  ± 5 nmi, based on many measurements of our own and others.  This is mainly due to uncertainties in atmospheric refraction, plus the sunset tables method has rounded base times and no correction for height of eye—someone high in the rigging will see the sunset a bit later than someone on deck.

Before we do the cel nav solution, just a note that using sunset tables included in official NOAA Tide Tables (figure below) there is usually an additional interpolation required. Also note that the sunset times do vary slightly (±1 min or so) over the leap year cycle, so you either have to have the right year or one that is exactly 4 years different from the right year.

Sunrise sunset tables from the official NOAA Tide Tables.  This is the only set we have around at the moment, which is not for the right year. It is just intended to show the format.  (This is a 2018 write up of an article started in 2013!) 


SOLUTION 2 CELESTIAL SIGHT REDUCTION USING COMPUTATION

If you know celestial navigation, an easy solution is to just treat this timing of sunset as if it were a normal sextant sight of the upper limb of the sun, and then do the sight reduction with a trig formula or with a cel nav program that computes the sight reduction. This approach has to be distinguished from solving the sight reduction using Sight Reduction Tables and plotting. It is possible to solve it that way, but that traditional approach takes more time and more graphic interpolation.

In this computed sight reduction approach, we have sextant height Hs = 0º 0.0’ (UL) at UTC = time the upper limb crossed the visible horizon. In this application we would have index correction = 0.0’ (no actual sextant involved) and height of eye (HE) = 10 ft in this particular sighting.  That is all a celestial navigator needs to know to find a line of position (LOP) from that sight. Since we are looking roughly westward at the time, this would be a roughly vertical LOP on the chart, and the place our known Lat crosses that LOP marks the Lon we are seeking.

A key point to keep in mind for this, and other direct determinations of Lon, is we are free to assume we know our Lat precisely. We have many ways to find accurate Lat, even without accurate time. Finding Lon is always the more interesting challenge.  We can get Lat very easily from a noon sight, or any two star sights, even if the watch used is wrong—we just need to know the time difference between the two star sights. A hack watch with unknown error will give us that.  In this type of star sightings, the Lat will be right, but the Lon will be wrong by an amount directly proportional to the watch error  at the rate of 15’ Lon error for each 1 min of time error.

Thus we will assume we know our Lat, and figure our Lon from the time of sunset.  So for now we just choose some random value of what we might have thought our Lon was before we did the sight.  Let us say our DR Lon before the sight was 124º 05’ W. In this case we actually know our true Lon, so our goal now is to assume some wrong Lon and then discover how wrong it was.

Next we do a normal computed sight reduction using HE = 10 ft and index correction IC = 0 and  Hs (UL) sun = 0º 0',  UTC = 03h 17m 49s on April 23, 2013, and we do this from a DR position of 48º 16.3’ N, 124º 05.0’ W. Also, looking ahead, we will use an air temp 49º F and a pressure of 1033 mb.

You can compute this sight reduction various ways. A convenient free solution for Windows computers is the Celestial Tools program of Stan Klein.  Or solve it directly with a trig calculator using the solutions we present in our online glossary under Navigator’s Triangle... although when you go that route we lose a lot of the efficiency. I want to stress that even though it is taking me some long discussion here to explain the procedure, once you have a good cel nav program in hand, the entire process takes seconds, not minutes!

The result of your computed sight reduction will be an intercept very close to:  a = 4.5’ A 290.1. Various programs may differ by a few tenths.  To check your  computed solution by hand you can use the USNO value of Hc (below), and apply the dip (-3.1') and altitude correction (-50.2') from the Nautical Almanac. Plus when doing it by hand we have to apply the additional altitude correction that depends on temp and pressure. This is done automatically in most computer solutions.

Angie's data did not include air temp and pressure, but we can look these up for nearby buoys (NDBC) at the time of the sight to find they were 1032 mb and 48º F.  Sample below


Since the standard is 50º F and 1010 mb, we have a small correction due to pressure alone, as shown in the Nautical Almanac table below.


Temp and pressure corrections from the Nautical Almanac. 

In our example, there is a -1.1' correction but notice that at more extreme values the correction on the horizon (Apparent altitude = 0) can be notable. These corrections are made automatically in most computer solutions, so you just enter temp and pressure. They might not even inform you of how much correction they made. And again I stress that these corrections have an uncertainty in them that is at least as large as the correction itself. These timed horizon sights have, overall, an uncertainty of about ± 5', with maybe slightly better average if done carefully in normal conditions.  Below is the raw data for a manual check of your favorite program.

Data from USNO site that we link to at www.starpath.com/usno.

Once we have our sight reduction done and found a = 4.5’ A 290.1 (again, this is seconds to enter the data and get the result), we can plot to get the answer very quickly. Below is a plot of the LOP using OpenCPN.

Plotting a celestial LOP as a route segment from a plotted waypoint in OpenCPN.

Here we plot a waypoint at the DR position that we used for the sight reduction, then create a one-leg route in the direction Away from 290 T (290-180=110) with a length of 4.5 nmi. Then we draw another route leg perpendicular to that (ie in direction 290+90=020) and that is our LOP.

Then draw in the known Lat line and measure the Lon where it intersects the LOP. In this case, we are very close. Just 0.75 nmi off the true position.  This is a satisfying result (clearly better than the sunset tables solution), but we still have to consider it fortuitous. Nevertheless, it is a superior solution, because it accounts for the height of eye and the additional altitude corrections for temp and pressure. Also we keep in mind that even though a procedure does have a known statistical uncertainty based on many measurements from various sources, it does not mean it will be wrong by that much.

Regardless of how you solve it, this method of finding Lon belongs in the navigator's bag of tricks and it also stresses the value of wearing a watch with known rate so you can always figure accurate UTC.  See our recent note on how to rate a watch for accurate time.


A passing note: Load lines on the vessel indicate that the height of eye may have been a bit higher than estimated, but this factor enters the sight reduction as a square root. So even if it were 13 ft instead of 10 ft, the intercept value would only change by 0.4'. Nevertheless, this is a reminder that in this type of sight and indeed all cel nav sights, we are better off using data as accurate as possible. In this example, this potential difference is not crucial. If the HE was 13 and not 10, then the error was just over 1 nmi, not 0.75 nmi, but if you are taking sights routinely from a higher deck, at some point it is valuable to just drop a line over the side and measure it. Only has to be done once.