Friday, April 26, 2024

Japan Weather — A Sample of What We Can Do For All Global Waters

We had an excellent question come up in class asking simply what are the best weather resources for the waters of Japan?  In our textbook (Modern Marine Weather) and in our training and resources app (Weather Trainer Live) we list all resources available worldwide and even have sections on specific regions, but realize it could be valuable to just focus in and list specific solutions for a sample area, with details needed to actually obtain the data underway.

So we use Japan for this example, stressing that these same sources (or counterparts) are available for essentially any part of the world.

_____________

(1) Model forecasts in grib format
The main workhorses we use anywhere will be the global model forecasts from GFS and ECMWF.  These data are available from saildocs with an email request to query@saildocs.com with this in the body of the message:

GFS:49.00N,24.00N,120.00E,158.00E|0.25,0.25|0,3,6..72|WIND,PRMSL

ECMWF:49.00N,24.00N,120.00E,158.00E|0.25,0.25|0,3,6..72|MSLP,WIND 

These files can then be viewed in any navigation app, such as qtVlm, OpenCPN, TimeZero, Coastal Explorer,  or Expedition or in a dedicated grib viewer such as XyGrib. Background on use of gribs at the Grib School. Luckgrib is a state of the art app for downloading and viewing grib data. 

Sample model forecasts. Red is GFS, blue is ECMWF

(2) Graphic weather maps
We need to check the pure model data from above with actual maps made by human meteorologists, and we have several sources of those. 


Above is a sample surface analysis (12z Apr 28) and below is the corresponding OPC map, which is as far west as they go (135E).


(2a) Weather maps from Japan

https://www.jma.go.jp/bosai/weather_map/#lang=en

Analysis chart

24-hr forecast

48-hr forecast

These are pdfs of about 550 kb, too large for sat phones as a rule, but it won't be long till all mariners have high speed internet offshore, then this type of link becomes more valuable. In the meantime, a supporter on land can download the file, copy the image from the pdf, reduce the file size, and email it to you on the boat.

Graphic weather maps are also available by HF radiofax if your boat happens to have the SSB radio and antenna set up. Japan stations are listed in the Worldwide Marine Radiofacsimilie Broadcast Schedules.  The many JMA maps available this way are listed at the JMH radio Station.

The other important radio related resource for international voyages is the NGA Pub 117, Radio Navigational Aids.  This tells, for example, what time of day you get VHF storm and navigation warnings for different parts of Japan. NAVTEX broadcast times are also given.

HF Fax is frankly an outdated technology (replaced by satellite communications), but if we could access the folder JMA store the images in we could request the same maps by email the way we do the US maps.

(2b) US OPC maps covers NW Japan waters

US maps only go to 135E (sample above), but they could be helpful on the approach from the east. See the Starpath Pacific Briefings page for examples and links. These are easy to obtain by email from Saildocs or FTPmail.

(2c) You can see UK maps of Japan waters at

https://charts.ecmwf.int/ and choose Eastern Asia region. These maps, however, might be just their model output plotted, which does not add knowledge.

(3) Satellite cloud pics
Japan has an excellent satellite image program (Himawari). See index to files here, which is also where you learn the file name you need to ask for.

https://www.data.jma.go.jp/mscweb/data/himawari/index.html


The latest visible image (b13) for Japan area can  be requested by email from Saildocs is


https://www.data.jma.go.jp/mscweb/data/himawari/img/jpn/jpn_b13_0000.jpg.  


The last four digits are the UTC of the image, available every 10 min, i.e., 0000, 0010, 0320 etc.  Himawari data are also excellent throughout the South Pacific.


This sample image is from 2 days later than other examples shown.


(4) Near live ASCAT winds

To get near live ASCAT winds, follow articles we have online about it and use links like the following for Central Japan waters:

https://manati.star.nesdis.noaa.gov/ascat_images/cur_25km_METB/zooms/WMBas254.png

https://manati.star.nesdis.noaa.gov/ascat_images/cur_25km_METB/zooms/WMBds254.png

https://manati.star.nesdis.noaa.gov/ascat_images/cur_25km_METC/zooms/WMBas254.png

https://manati.star.nesdis.noaa.gov/ascat_images/cur_25km_METC/zooms/WMBds254.png

You can use the same set of links for Northern Japan by changing the file number to 253, and for Southern Japan use 242.  You can get these online or ask for them from Saildocs by email. For background see starpath.com/ASCAT.

Sample ASCAT pass

(5) Live ship reports
You can also get a list of all ship reports near Japan by sending a blank email to shipreports@starpath.com and put the central Lat Lon in the subject line, such as 37.0 N, 140.2 E. (See starpath.com/shipreports.) This gets a list of all the reports plus a GPX file of the reports that can be loaded into a nav app to see actual locations and data.

(6) Ocean Currents.
You can get ocean currents and SST for that region from RTOFS request to Saildocs

RTOFS:48.00N,22.00N,122.00E,158.00E|0.08,0.08|0,3,6..72|CURRENT,WTMP 

For background on currents see starpath.com/currents.

(7) Waves and sea state.
GFS is best for this, again available from Saildocs. There are many sea state parameters (see Grib School list), but these are likely of interest most often:

Significant Wave Height of the Combined Seas (HTSGW)  

Primary Wave, Direction it comes from (DIRPW)

Primary Wave, Mean Period (PERPW)

GFS:54.00N,22.00N,120.00E,164.00E|0.25,0.25|0,3,6..72|HTSGW,DIRPW,PERPW 

(8) Tropical cyclone warnings and reports
Primary source is Japan Meteorological Agency, which is also the Regional Specialized Meteorological Center (RSMC).

To get the latest Japan waters text reports from Saildocs, use send Met.11por

To see how to get reports for other parts of the large metarea XI, use send metarea

Other metareas around the world...
(9) Special sources (with thanks to Mark D'Arcy for this reminder)
JMA, like other maritime nations, has weather models of their own, but the grib format is a paid service. You can see their MSM model at windy.com, but the higher-res LFM is paid only.

Many maritime nations also have universities or other agencies that run a localized version of the Weather Research & Forecasting Model (WRF). These high-res data can be very useful when available.  Japan and South Korea have WRF data available from selected resources, such as the weather and nav app Expedition


Monday, April 22, 2024

Choosing the Best Sextant Sights

 The criteria for choosing best sights is outlined in the Star Finder Book and in the manual to the StarPilot programs, but this online course has shown us that we need more specific notes on this. Again, this is the type of thing we generally covered in the classroom lectures, so it had been only sparsely covered in the printed materials to date.

The goal of sight selection is always to optimize the accuracy of the fix. If only two sights are available, then these would be ideally about 90° apart in bearing so that intersection errors are minimized. This is the same criteria used in choosing targets for compass bearing fixes in pilotage waters. If instead of 90° apart, the two targets were only 10° apart, then any small error in either of the bearings would cause a large error in the intersection when the LOPs were plotted. 

Use any chart and plot a bearing fix to two objects that are 10° apart and then repeat the plot assuming one of the lines is wrong by 3°. Look at how much the fix changes. Then do the same thing for two objects that are 90° apart at about the same distance off. When they are 90° apart the error will be 5% of the distance to the nearest mark, or something near that. But for the two close bearings the error will be much larger.

For a two-sight fix, this "scissor effect" on the shift of the intersection is minimum at 90°, but from a practical point of view, any LOP intersection angle more than about 30° will reduce most of this error enhancement, and you really don't gain much going to intersection angles above 60° or so.

The same reasoning applies to cel nav fixes. First if you are limited to two sights, then they should be some 30 or more degrees apart... ideally closer to 60 or 90. And, as always, you should take at least 4 sights of each object if you can, alternating at least the first couple of them. The reason for alternating, is to cover the situation where you just get two sights then something happens. If these are two of the same body, you are left with only an LOP, but if of different bodies you have a fix. Not the best you might have gotten, but at least a fix. For the record, I have been on two vessels where my sight taking was interrupted early in the process, and in both cases, a cel fix at the time was crucial. In the first case, the boat under spinnaker in the ocean broached on a wave, which kept us busy with immediate sailing issues even more crucial than improving the quality of the fix. In the second case, a pressure cooker exploded below decks, and the first aid issues again took precedence over the navigation. Needless to say, both of these examples are rare cases, but the goal of sound navigation is to develop procedures that cover you even in unusual circumstances. 
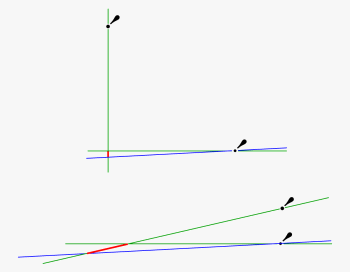
Figure 1. When LOPs are closer than some 30° apart, the fix errors are greatly enhanced (red lines) due to unavoidable uncertainties in the bearing lines. Here the error shown is 3°.

Also in cel nav we have limits on altitudes. Generally you would choose sights above about 15° and below about 75°. This is for two separate reasons. Low sights, especially down within say 5° of the horizon are more influenced by refraction. Refraction is the one uncertainty we do not have much control over in cel nav. We routinely make refraction corrections, but we are always vulnerable to abnormal refraction. In other words, mirages do indeed exist, and some are very prominent from the water in some circumstances. Mirages are an impressive demonstration of the presence of abnormal refraction. In the open ocean, when there is no land or vessels over the horizon to see mysteriously floating above the horizon in a mirage, we have no way to know that abnormal refraction is present, so we have to just be vigilant. There are special tables in the Nautical Almanac for correcting for abnormal refraction based on temperature and pressure, but what is not stated in these tables is the fact that the uncertainty in these corrections are about as large as the corrections themselves. Indeed, we do not even include these in our routine procedures, unless you are forced to take low sights, in which case they probably statistically would be right more often than wrong. Sights within some 5° of the horizon might be off by as much as 5 miles or so, even with the special corrections. Not always, and maybe even not likely, but definitely possible.

The best bet is to just avoid low sights whenever possible. Refraction correction is about 35' on the horizon, then 10' at 5° and 5' at 10° and then it just gets smaller as the elevation (Hs) gets larger. Look at the altitude correction for stars, since that is pure refraction.

The reason for avoiding high sights is completely different. There are two reasons for avoiding high sights. One is they are harder to take because the bodies are nearly overhead, which makes it difficult to tell which way to point the sextant as you rock it. For high sights it is easy to be misled into thinking you have the body aligned with the horizon when you do not. Hence if you do get stuck and need to take very high sights, be aware of this issue when rocking the sextant.

The other problem with very high sights is the sight reduction process itself. For high sights the LOPs cannot be accurately approximated as straight lines (which is our normal procedure), since the the circle of position now has a relatively small radius. Later we will add a section on processing high sights, for now the issue is just to avoid them if possible. If you are eventually using the StarPilot for sight reduction, then this issue is taken care of automatically, but when sight reducing and plotting by hand, we need special procedures for sights above some 75°. It is not difficult, and does not require special tables or compuations, but it is different.

Summary so far: for two sights only, choose the two bodies as close to 90° apart as possible and find bodies that are above 15 and below 75 degrees in height, and then take 4 sights of each to average for the two best LOPs. Sight averaging is covered in the course book, chapter 11.

But... with all that said, two stars (even in the right elevation range) are not the best option in the first place. Three stars are much more valuable for an accurate fix. Even if you take multiple sights of the two bodies, which reduces your statistical errors from any one measurement, you still are left with just two LOPs, the average from each set. You do get a picture from the plot of the LOPs what this level of uncertainty is — the more they are spread out the more uncertain the fix is — but you do not learn anything about systematic, or constant errors that might apply to each sight.

That is the value of choosing 3 sights that are about 120° apart. In this configuration, any constant error in each sight simply makes the triangle of LOPs (called the "cocked hat") larger, but the center of the fix remains an accurate position. This is not the case with 3 sights that are 60° apart, even though the final cocked hat of intersections might look identical. As time permits, we will add numeric examples to illustrate this important point, for now, however, the main goal is to explain the rest of the criteria beyond the geometry.

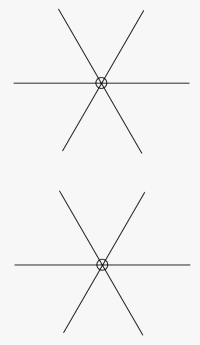
Figure 2. This is the way 3 LOPs would appear if there were no errors at all in the sights and they were reduced using the true position as the AP for each sight.

The top picture is for 3 sights taken 120° apart, the bottom is for 3 sights taken 60° apart. 

Assume that Hc = 30° 20' and Ho = 30° 20' for each sight

While the choice of geometry (selecting 3 bodies as near 120° apart as possible) will always be the dominant criteria in selecting bodies (along with above 15 and below 75° high), there are other criteria as well. The other factor is brightness. You can take more accurate sights of ones you can see clearly. So when all else is equal, or about equal, then choose the triad that includes 3 of the brightest stars. For example, if you have 3 stars that are very near 120 apart, but one of them is a magnitude 2.5 star, then you would almost certainly get a better fix from 3 that were, say, 130 and 110, 120 apart. In other words, you can tweak your choice to give up 10 or 20 degrees in optimum angle in exchange for brightness. There is a big difference in apparent brightness between a magnitude 2.3 star and a magnitude 1.5 star. See the table in the Star Finder book which coverts the magnitude scale to perceived brightness.
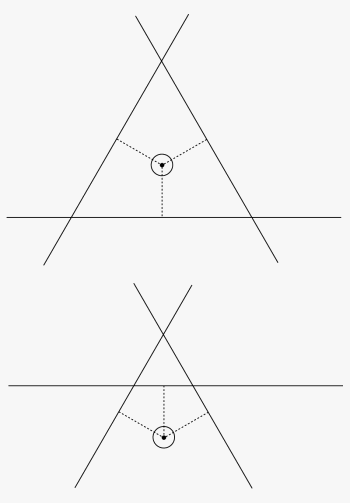

Figure 3. Now we show the same sights as above, but now assume there is a contstant 5' error in each sight, ie the sextant read 5' too high on each sight. We now have Hc = 30° 20' and Ho = 30° 25' for each sight, which gives a = 5' T 060, 180, and 300 for the top sights, taken 120° apart and a = 5' T 300, 000, 060 for the bottom sights taken 60° apart. They are all again reduced from the true position.

Note that the center of the top sights is still the proper fix, even with a constant 5' error, but in the bottom case, if we chose the center of the triangle as the fix, we would not get the right answer.

The main point is, we do not know what the error is, so we can't guess ahead of time where the fix should be for 3 sights 60° apart. We only know that the final uncertainty is larger than we would guess from the size of the "cocked hat" of intersections.

Once you have chosen several possible triads that have comparable quality on spacing and brightness, the final criteria would be to choose the triad that has the 3 stars at about the same height. This is again because of refraction. A star at 70° has a different refraction correction than one at 20° and if you happen to be in a case with abnormal refraction, you will magnify this effect by having stars at different heights. Again, the goal is to take advantage of the 120° geometry. If we have a refraction uncertainty, then to first approximation it will be the same error for all 3 stars if they are at about the same height. And if the error is the same for each sight, it will cancel out with the 120° geometry. We have of course removed the main effect of refraction by limiting all sights to above 15°, but this is now the third level of choice criteria, which is really fine tuning the process. The first filter kept our unknown errors below a 2 or 3', this final choice might help us get to the optimum accuracy of some 0.5' or so.... all providing we have taken into account the motion of the boat properly. 
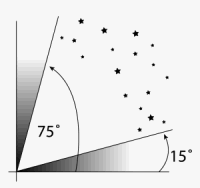

A graphic reminder that when we have a choice, we choose sights above 15° and below 75°. Naturally, if there are no other options, we take any sights we can and keep in mind the special issues of each region.

If you do not advance all sights properly, then you loose accuracy according to your speed and time in the sight process. If I am moving at 6 kts, and take 30 minutes to do my sights, then I have a 3 mile uncertainty floating around that will mask much of this fine tuning in star choice if I do not correct for it. This again, is a virtue of the StarPilot or other computer or calculator based sight reduction. All sight reductions automatically advance all sights to the time you ask for the fix.


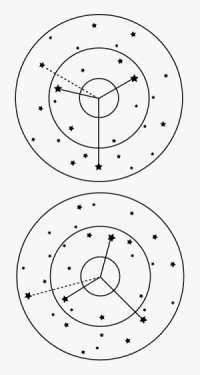
In the top picture, we give up a superior 120° spacing in favor of a brighter star that has fairly good spacing.

In the bottom picture, we sacrafice a bit of spacing for 3 stars at about the same altitude... or more to the point, to avoid one that is rather different than the other two.

All of these choices are fluid. The general criteria is discussed in the text, and from that you make your best choices and try options if you have the opportunity. Or take them all and do the fixes in various triad combinations to learn more of the practical matters.

For the record, in the StarPilot program, which is the only software available that actually sorts out and selects best sights from any sky, we use as a default weighted criteria: 70% on geometry, 20% on brightness, and 10% on relative altitudes, with Hc max = 75 and Hc min = 15. Each of these criteria can be adjusted by the user.

Friday, April 5, 2024

Role of the Safety Depth in ENC Display

When viewing an official electronic navigational chart (ENC), the user selects three depth contours (shallow, safety, and deep) and also sets one specific depth value called the safety depth. These four choices affect the colors of objects we see on the chart, as well determining several other features of the chart display.

The safety contour is the most important one as it separates what is called the safe water from the unsafe water. It will trigger alarms and it determines when isolated hazardous objects change from their normal symbol into the prominent isolated danger symbol, which is determined by the requested safety contour and not the displayed contour, which are often different. This takes some attention, but that is not the topic at hand.

We deal here with the safety depth, a simple number, not a contour on the chart, and thus something simpler than the safety contour — but not quite as simple as a first glance might imply.

The most notable effect of the safety depth is to change the color of the soundings. All soundings on the chart that are less than or equal to the user selected safety depth are shown in black, whereas all soundings deeper than the safety depth are shown in a less notable gray shade.


In this example, we wanted a safety contour of 35 ft, so we set the requested safety contour to 35 ft and also set the safety depth to 35 ft — it is generally good practice to make these equal. But in this chart there was no contour at 35 ft, so it chose the next deepest contour as the displayed safety contour, which was 60 ft. The safety contour is always shown as a bolder contour. 

Our choice to also set the safety depth to 35 ft changed all soundings deeper than that to the less prominent gray, leaving the serious ones we care about as black. In this chart, the displayed safety contour does not very well mark the waters we want to avoid, but we can now see this fairly clearly by the color of the soundings.

That is the main job of the safety depth. All soundings will respond to this color demarcation, including those that are part of another symbol.

And often, even usually, that is all that is ever said about the safety depth choice: it determines if a sounding is gray or black. We have likely even said in our own early discussions that this is what the safety depth does... "and nothing more!"

But that is not really the case. In working on our forthcoming new booklet called Electronic Chart Symbols: An Annotated ECDIS Chart No. 1, we were reminded that the all important generic hazard symbols for wrecks, rocks, and obstructions with known soundings are indeed supposed to change background color from blue to transparent when their sounding is greater than the user selected safety depth.

Below are a couple samples.


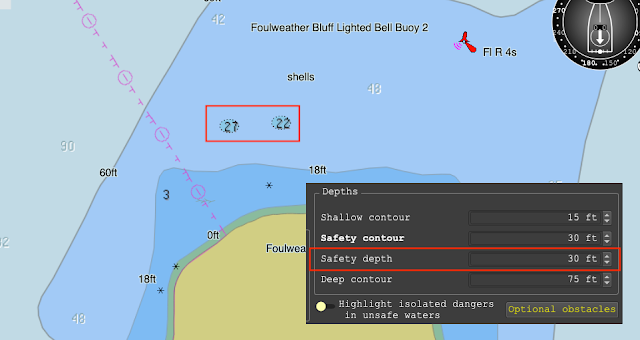
Here we have two generic hazard symbols with known soundings. These could be rocks, wrecks, or obstructions. We do not know till we cursor pick the symbols.

They have soundings of 27 and 22 ft. The cursor pick report of the right one is shown. The safety depth has been set to 20 ft, so both of these rocks are deeper 
than that so the symbol is transparent.

Now, we leave everything the same, but change the safety depth to 30 ft. In other words, we consider water 30 ft or deeper to be safe, but these two rocks are only 22 and 27 ft under the water at tide height = 0.


The effect has been to change the soundings color to black, but also notable it has changed the hazard symbol from transparent (less notable) to a blue that will always stand out.

All the common generic hazard symbols behave this way. They are all identical dotted ovals with the sounding inside. They look the same but they could be a rock, a wreck, or one of many kinds of obstructions.


Summary: Left hazard has sounding deeper than the safety depth; right hazard has sound equal to or less than the safety depth. The hazard could be rock, wreck, or obstruction.


Here is another example.


These five examples of submerged hazards with known soundings are all rocks, but we would not know that without cursor picking each one to get its properties. These could be wrecks or obstructions. In this view, the safety depth was set to 10 ft.

The chart samples shown here are from the free nav app for Mac or PC called qtVlm. We use it in our Marine Weather course and in our course on Electronic Chart Navigation. qtVlm has a top of the line presentation of ENC that adheres to the IHO standards on symbols and functionality. 

Below is one final example with practical aspects.


On the left we choose a safety contour to match the shape of the bank, which could be useful for depth piloting, with the safety depth equal to the safety contour, which is standard procedure in many cases.

But if we are in a sailboat with an 8 ft draft, then we might consider 12 ft as  a safe depth, and with the safety depth set to 12, we see the hazards we need to miss as we cross the bank as close to the island as is safe.

A subtly of this symbol convention comes to play in the shallow water between the shallow water contour and the foreshore when using a 4-color display or between the safety contour and the foreshore when using a 2-color display, because the official fill color of the danger symbol is the same as the water color in that region.