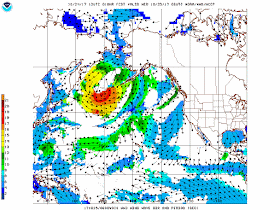
By tomorrow about 06z the wave forecasts are for 60 ft, significant wave height of combined seas (SWH).
 |
WW3 model forecast displayed in LuckGrib. The color bar is for wave height in meters. Light blue is 17-18m (60 ft), Pink is 16m, red 14, yellow 10m |
We see SWH of combined seas of 60 ft, but strangely this appears to be mostly all wind waves. The swell component in that region at the time is very low... in fact the WW3 model does not give swell data in the high wave region at all. They just give combined seas and wind waves, and throughout that region the wind wave heights are within a few feet of the combined seas heights. The forecasted hurricane force winds are completely dominating the sea state. Swell directions along the perimeter of the system are in all directions. This storm will indeed generate huge swells for other places later on, but at the actual storm site the prevailing swell seems to be very low.
SWH is the average of the highest one third of all waves in a statistical distribution. Other wave heights in that distribution are given in this table from our text Modern Marine Weather.
With SWH at 60, we expect the average of the highest 10% to be about 78 ft and 1 in 2,000 to be 120 ft. These waves have a period of about 17 seconds, so 2,000 x 17 = 34,000 seconds, which is about 9 hours. So very roughly every 9 hours or so a region would have a wave of 120 ft and it would not be considered a rogue wave. It is just at the far edge of the expected distribution of wave heights.
But there remains a valid question of where does the base 60 ft wave height come from? Note too that an average period of 17 seconds is more typical of swells than wind waves, but these are very big waves and this is indeed a normal period for these huge waves. In fact, the waves themselves are consistent with this wind pattern which has had a fetch of some 700 nmi for a day or more. These stats are compiled in the diagram below.
The winds have been 60+ for a long time, so just follow the 65 kt line across the diagram to a fetch of 700 or so and you see 60 ft waves with a period of 17 seconds... also note that the duration is 36 hr, all consistent with the present system.
So, in short, we get big waves, as would be expected in this system. A few pics below present other specifications of the system.
This pic shows the swell direction on the edges and lack of swell ht forecast in the system. The red line is 863 nmi long, and this storm needs only 700 or so to fully develop these seas.
Below are images from the WW3 site, showing period and direction of peak wave energy, SWH of wind waves, and wind wave direction and period. These can be seen by googling "NCEP model guidance" (to find this page mag.ncep.noaa.gov/model-guidance-model-area.php), then choose NPAC (North Pacific) and WW3 model, then choose time frame, and product.
Another valuable presentation of even more WW3 parameters is at polar.ncep.noaa.gov/waves.
Note the red patch of 18-sec period at the storm are waves, but the red 18 seconds off of Baja and farther to the SE are swells. See below to note there are no wind waves in the Baja region... and the ones that are there farther offshore are going opposite directions, likely remnants of a front that is long past.
Here is an ASCAT satellite pass measuring true winds of 50 to 66 kts over a 500 mile swath at about 4 PM PDT today. Viewed in LuckGrib. This is a big system! Not clear how far it extends to the west. Watch the ASCAT data online to see real values tomorrow. LuckGrib can show these in GRIB format, as can the Ocens Grib Explorer Pro for iPad.
________________
Here is a follow up for the next day, Thursday, Oct 26. Reports of measurements of SWH 57.8 ft. Nice to see that science works! This gcaptain report mixes up terminology a bit, but actual values will be known better later on.


Amazing! Fascinating post David! I really enjoyed it. Be great to get in touch sometime. My email is fun@modelsailboat.com I have great memories of working together. Will Lesh
ReplyDeleteDoes that have a chance of reaching Washington/Oregon?
ReplyDeleteNo Not at all. These in fact did not last that long at these enormous heights, although the waves were still huge for a day or more. They are down to 6 or 7 meters i would guess. This storm took place at what is a normal home for such big storms, an action center called the Aleutian Low, and they were exacerbated by the long fetch. That is not to say we cannot get very large waves in OR WA coast. I would check back to the sea state of the famous Columbus Day storm. Google that and you will likely find the biggest waves hitting our coast.
ReplyDelete