Thursday, August 23, 2012

Leif Karlsen's work on Viking Sunstones

A recent article in the Proceedings of the Royal Society of London addressed the issue of the use of calcite as a Viking Sunstone. The authors mentioned Leif Karlsen, but apparently were not aware of the full extent of his work on this subject, nor that he had demonstrated this very thoroughly many years earlier. The response below is adapted from the  follow up note on this subject published by the Society.

Leif's work is described in Secrets of the Viking Navigators.


Comment on
‘A depolarizer as a possible precise sunstone for Viking navigation by polarized skylight’

by
DAVID BURCH
Starpath School of Navigation, Seattle, WA, USA

Abstract: Attention is drawn to the related work of Leif Karlsen.

A main conclusion of this work by Robars et al. is that a piece of Iceland spar (optical calcite) can be used in a simple manner to find the direction to the Sun using polarized light, even when the Sun is obscured by clouds or just below the horizon, which supports the possible role of the renowned sunstones discussed in Viking Sagas. They propose a method of using an opaque spot on the incoming face of the crystal as a means of detecting the proper orientation of the crystal when aligned with the azimuth of the Sun. They also point out that a recent discovery of a calcite crystal in an Elizabethan shipwreck near Alderney in the Channel Islands might have been used for navigation in a similar manner.

I first express my appreciation that this line of research and analysis has been brought to the attention of the scientific community and, indeed, to the public at large, as their article received much attention in the popular media, worldwide, as would most news related to Vikings.

I wish to point out that the authors may have overlooked the significance of the pioneering work on this subject by the late Leif Karlsen. Although Karlsen worked on this subject extensively for the last 20 years of his life, and his work was well known among those specializing in Viking navigation or special uses of crystals, his work was not published in standard scientific journals. His main report of this work is in his book Secrets of the Viking navigators—How the Vikings used their amazing sunstones and other techniques to cross the open ocean (Karlsen 2003) and later in the Navigators Newsletter, quarterly publication of the Navigation Foundation (Karlsen 2006). It was also reported in my book Emergency Navigation (Burch 2008).

Karlsen’s book is in an unusual format, which could account for the oversight. In part 1, Karlsen presents a fictional account (on the basis of his extensive study of the Sagas) of a typical Viking voyage, including a narrative on navigation instruction to a new navigator. In this format, he presents (i.e. p. 26) his concept of the practical applications and use of the sunstone. In part 2, he describes what he learned to be the key steps to precise, reproducible results, with a summary that the Sun’s direction (in good conditions with a good crystal) could be obtained to a precision of one degree. Only at the end of the book in the appendix does he discuss specific results with sunstones and his own studies.

His discovery, years earlier, of how to make the measurements using what Ropars et al. call an ‘opaque spot on the entrance surface’ is the key to the Karlsen measurements. Karlsen used a 3-mm square piece of opaque plastic electrical insulating tape. (Vikings might have used a drop of pine tar, in common use in boat building.) He also developed a simple apparatus for achieving precise bearings by mounting the crystal over a mirror, all of which is mounted to an azimuth ring on ball bearings, with sighting vanes at the two ends of the crystal. His original instrument has been on display in the Icelandic Room of the Nordic Heritage Museum in Seattle since 1998. Vikings would not have had access to mirrors or compasses to aid the measurement, but would have looked up to the sky through the crystal, as mentioned in one of the Viking Sagas.

Much of his original data are still available. In short, he used his apparatus to locate a point on the horizon that coincided with the direction of the Sun at a specific time as he determined it with his sunstone. Then he would use a precision compass to measure the bearing to that point and then compute the Sun’s bearing at that time from the Nautical Almanac and compare them. The key point in this process is the compass bearing, which must be done carefully and with confirmed lack of external influence. As a ship’s officer for 40 years, he was well aware of accurate compass work and made all appropriate checks. The best of these data are for very low Sun positions or just below the horizon, and for these the average he reported was about ±1◦.

I would stress, however, that it is not his reported accuracy itself that highlights his work, but rather his clear proof that his method was a viable one for practical use. He travelled throughout Scandinavia and the USA to demonstrate his method to Viking experts, mineralogists and museum curators. He even demonstrated the method underway on Viking replica vessels, on typical Viking voyage routes, and he received much acclaim for this work.

Though not the method he used, for more casual measurements using a clear crystal, a reproducible direction of ±10◦ or so is easily demonstrated by looking up through the crystal using the crystal shape for orientation. This level of accuracy would be valuable to primitive or emergency navigation.

I believe that the sole reference to Karlsen’s work in the cited paper that reads ‘... as earlier qualitatively observed (Karlsen 2003; p. 10)’, is not representative of the extensive, careful work that Karlsen accomplished over many years, which was subsequently verified by several independent observers, and thus I wish to add this note to their publication.

Further to Leif Karlsen’s contribution, I would add that the reference made in 2011 by Ropars et al. (2011) to the recent Albernady discovery was actually reported for the first time in Leif Karlsen’s book. The discovery came coincidentally at the very time of the final preparation of his book in 2002, but more to the point, it was Karlsen who put the pieces together to first conclude that this particular discovered crystal might have been a sunstone used for navigation. Karlsen’s book includes a photograph of the discovered crystal and the diver who found it.

For completeness, I note that Karlsen was not the first to propose a black-spot method for calcite. Ramskou (1969) describes the method for calcite in 1969 (using a side of the crystal for reference), but did not report measurements for calcite at that time. He did report results for cordierite (iolite), which were made from a DC-8 aircraft, presumably using a different method suitable to iolite.

I stress that this note addresses only the referencing of the black-spot method in the Ropars et al. paper, not their hole-in-screen or Haidinger-brush methods.

References
Burch, D. 2008 Emergency Navigation, 2nd edn. Camden, ME: McGraw Hill.

Karlsen, L. K. 2003 Secrets of the Viking navigators: how the Vikings used their amazing sunstones and other techniques to cross the open ocean. Seattle, WA: Starpath Publications.

Karlsen, L. K. 2006 Viking navigation using the sunstone, polarized light, and the horizon board. Navigator’s Newsletter. J. Navig. Found. 93, 5–6.

Ropars, G., Gorre, G., Le Floch, A., Enoch, J. & Lakshminarayanan, V. 2012 A depolarizer as a possible precise sunstone for Viking navigation by polarized skylight. Proc.R.Soc.A 468, 671–684. (doi:10.1098/rspa.2011.0369)

Ramskou, T. 1969 Primitiv navigation for Kompassett, p. 71. Copenhagen, Denmark: Rhodos. (An English summary is included.)

----------

The original of this comment and referenced documents can be found at the Proceedings of the Royal Society.

Saturday, August 4, 2012

Canadian eCharts for Electronic Chart Systems


Most Northwest mariners will eventually head up the inside Passage to Alaska or at least to the beautiful inland Canadian waters of the Inside Passage, not to mention trips to the Gulf Islands, just northwest of the San Juans, and for these ventures we will need charts.

Canadian paper charts serve well, indeed, some mariners even are biased toward Canadian paper charts when they have an option of US or CND. Obtaining and using these are the same as always. Catalogs work the same, prices about the same, and outlets the same.

What is dramatically different once we cross the border, however, is the use of echarts, which is more and more a part of our routine navigation–or at least it should be considered if not yet done.  Even if one does not choose to navigate point to point by ECS (electronic charting system), echars remain extremely valuable for route planning, since many ECS include one button display of tides and currents–some will even pull in the latest weather map and forecasts.

The big difference for US mariners is, unlike the US NOAA echarts, which are all free of charge, Canadian echarts are not free. Being not free, also means they are encrypted, which adds a layer of complexity to their use.

Another layer of complexity is the new generation of echart programs from Nobeltec and MaxSea called Time Zero do not run standard format echarts at all, which has pros and cons for users and suppliers. If we were all running Macs, we would be accustomed to this control for the sake of conformity–it is not all a matter of revenue. Otherwise, modern echart programs like Coastal Explorer, Memory-Map,  and OpenCPN will run echarts from any source.

Next we have the common decision to make that applies to all echarts: Do we want raster charts (called RNC), which are graphic images of the actual printed charts, or do we want vector charts (called ENC), which are essentially formulas for the various components of the chart, which are then drawn on the fly as the ECS displays them. There are pros and cons to each, which we discuss in a forthcoming post.

I would venture to say that most mariners entering into the use of echarts for the first time will prefer the RNC, since they look like the charts they are used to. If asked, that would also be our strong recommendation. RNC are large files; Enc are small files.

Both sides of Vancouver Island and Puget Sound is 1500 MB from one source as RNC, where as the same region covered by ENC would be about 100 MB or less.

There are several sources for the Canadian echarts. The primary one is the Canadian Hydrographic Service (CHS) who actually make the charts.  They in turn have licensed the rights to sell the charts to several other companies worldwide.

CHS has also licensed them to be incorporated into proprietary GPS charting systems, but that is not the topic at hand.These are usually sold on cartridges that plug into the GPS units.  For now we are discussing echarts purchased to be viewed and used in your own ECS system, meaning some echart navigation software program.

--------  Price comparison for Vancouver Island waters -------- 

Raster charts (RNC) in BSB v4 format

(1) CHS price $175 each, sold separately for inside and outside.
Runs in most programs that will run BSB4 format. (Will not run on Time Zero products). They seem to still include a chart viewer on the CD, but this viewer will not work on 64-bit systems such as Vista and Win7.

(2) MapMedia charts $300 for inside and outside, sold together.
These run on the new Time Zero ECS from Nobeltec and MaxSea. Includes 3d data and satellite images. They also include some inland waterways, and some related 3d and sat photo data.

Both offer free updates for the first year. MapMedia plans to charge half price after that, and CHS plans to sell us a new set after that…. but both of these programs will certainly change.


Vector Charts (ENC) in S-57, v3.1 format

(1) CHS price is $600, for each side.
The inflated price is because these are certified for use on commercial shipping, which (A) require more rigorous format standards (ECDIS), and (B) the customer base has more money.  Recall again, that the US counterparts of these are free, but they do not offer any Canadian charts... in fact, Canada has prohibited even any overlap of these as of July 2012 (see www.nauticalcharts.noaa.gov/mcd/enc/USCanada_Atlantic.htm)

(2) MapMedia S-57 $300
Covers inside and outside, but there is not option but to include 3d data and satellite images. The extra products provided are not needed for navigation, but added in large part to justify the high costs for these files.  These charts do not meet the ECDIS standards, nor other standards for vessels required to carry charts on board.

In principle there is an advantage to the MapMedia vector chart base besides the price, in that they offer for sale vector charts from several sources, including Jeppsen and Navionics. Vector charts are not all the same (this is not one of their advantages over raster charts!), so with inside information we can chose the ones that work best for a given region.  

MapMedia is a French company that is owned by the same company (Signet) that owns Nobeltec and Maxsea. Signet is jointly owned by Furuno-Japan and their French partner.

Wednesday, August 1, 2012

How to get ASCAT Winds from Saildocs

We have several articles in this series about ASCAT. Search the blog on ASCAT to find them.

At one time  (2012-2014) we offered a free email service of our own that provided the ASCAT images from OSWT, but we discontinued that primarily due to endless spam attacks.  But our service always include this note:

"For completeness, we mention there is another way that you can customize this task using the powerful email service of saildocs, which is well known to many cruising sailors, although we guess not many are taking advantage of this powerful feature."

This note is an explanation of that process.  First we will need to know what file names cover the regions of interest. These are obtained from the graphic index at http://manati.star.nesdis.noaa.gov/datasets/ASCATData.php.

Go to that map and put your cursor over the region of interest and note the file name in your status bar. There are two index maps, one for ascending passes, the other for descending passes. You will see the file names are very similar.

The world is divided into small Lat-Lon grids of 10º x 15º in size.

Then the process is this:

Send an email like this:
----------------------------
 TO:  query@saildocs.com
SUBJECT:  anything

BODY:
Send https://manati.star.nesdis.noaa.gov/ascat_images/cur_25km_META/zooms/WMBds86.png
---------------------------
Then in a few minutes you will get the graphic image of the winds you want. This will always be the latest data, but the latest may be some hours old depending on latitude and time you ask for it. The trick is to make your own index of the regions you care about and you can ask for several in a row to get what you want.

That is, you would immediately ask for the ascending pass with:

Send https://manati.star.nesdis.noaa.gov/ascat_images/cur_25km_META/zooms/WMBas86.png

The 86 is identifies the region 30N-40N x 75W-60W,  and the as vs ds identifies the pass, Ascending or Descending.

The file size for this 25-km resolution will be about 35 kb. The larger overview at 50-km will be about twice as big.

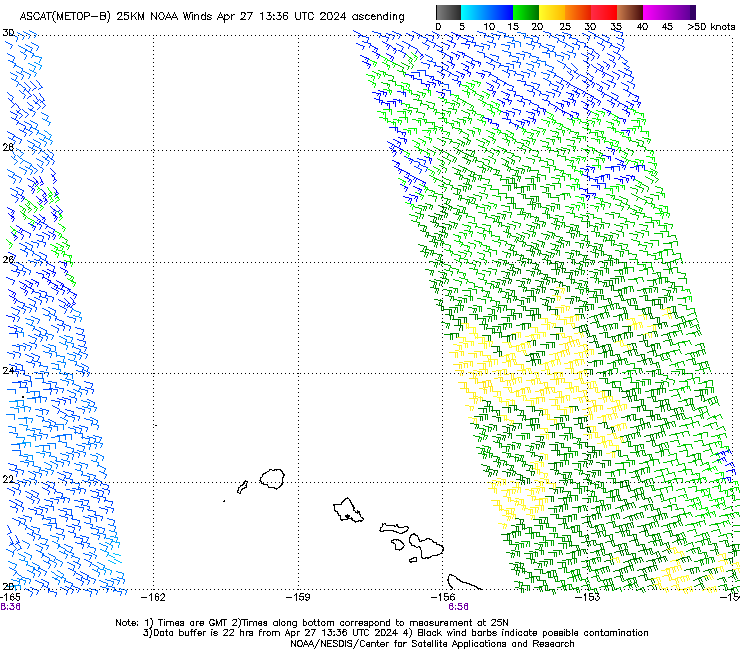
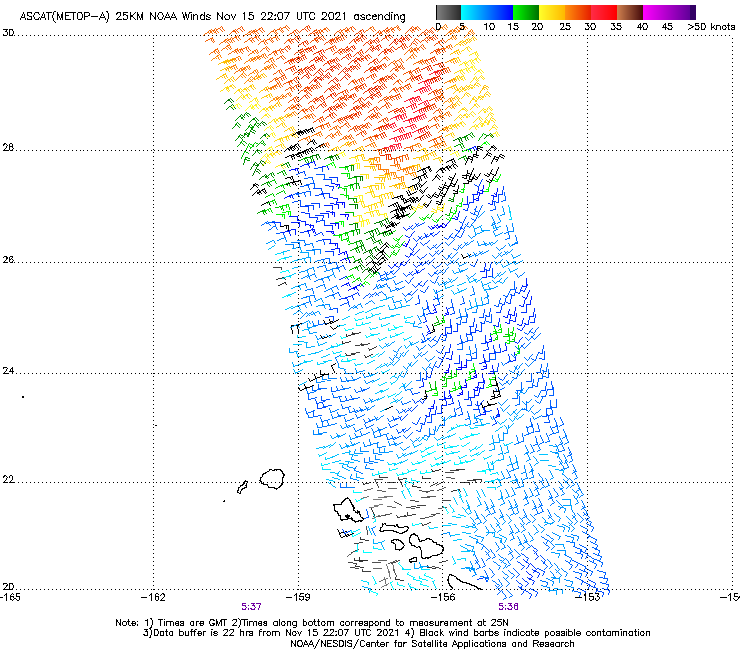
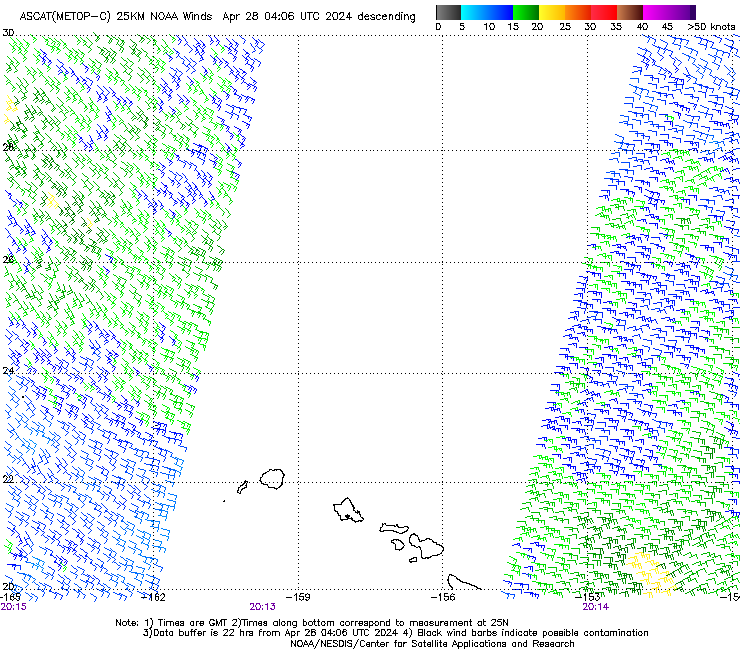
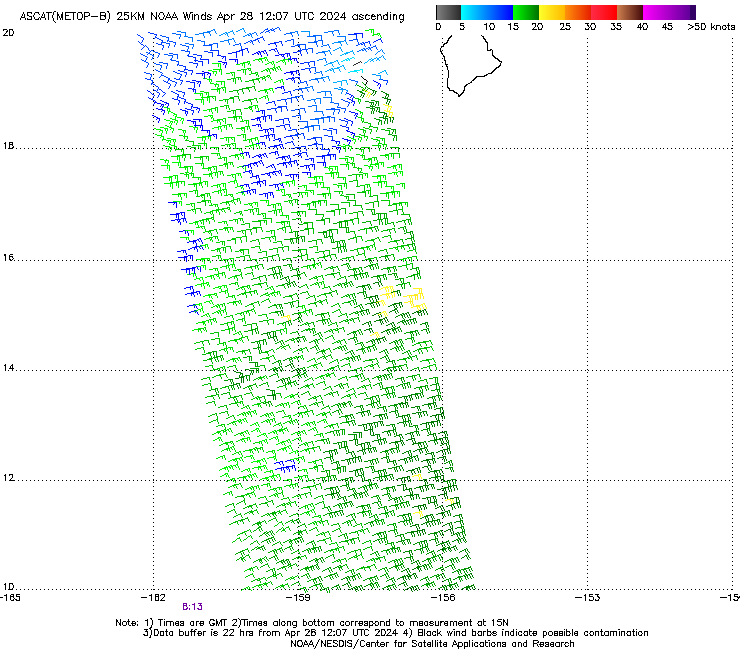
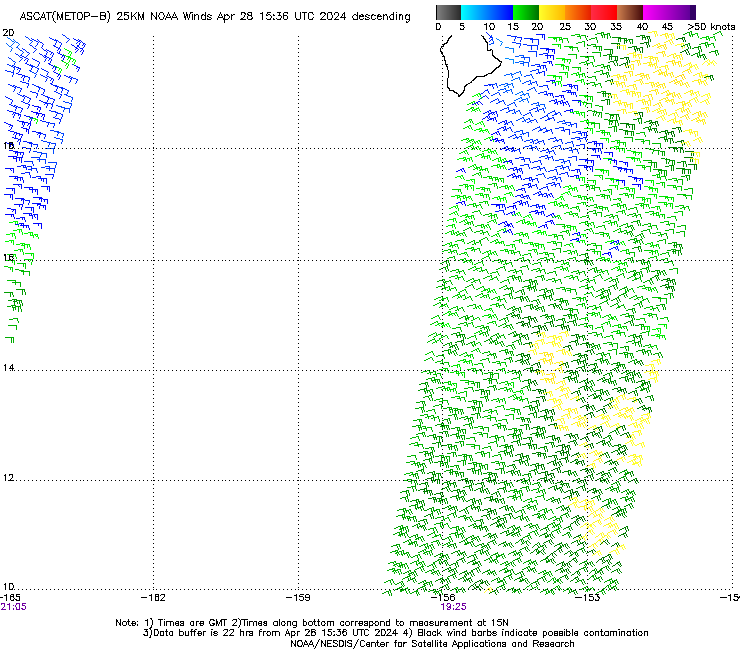
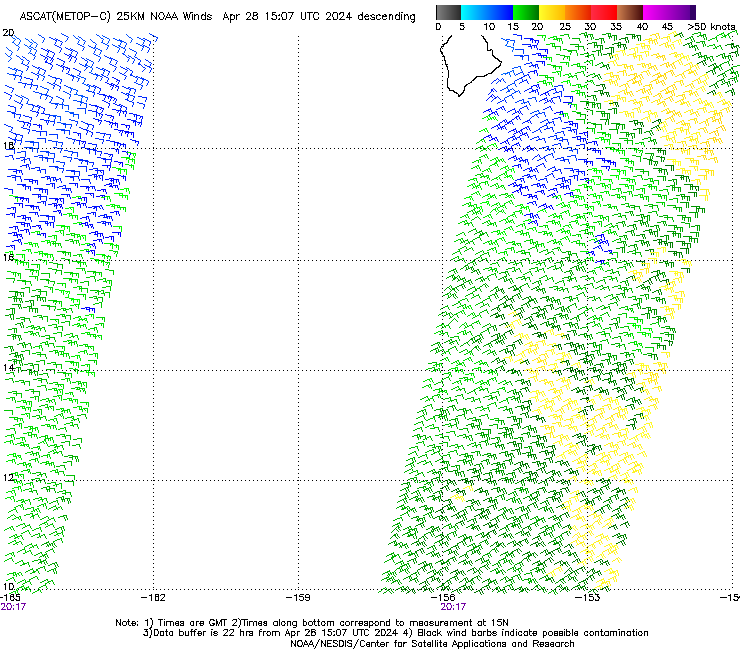
The above sample is for waters around Bermuda.  If you want HI waters use

HI North
https://manati.star.nesdis.noaa.gov/ascat_images/cur_25km_METB/zooms/WMBas15.png


https://manati.star.nesdis.noaa.gov/ascat_images/cur_25km_METC/zooms/WMBds16.png

You can do this with any email access from your boat, or from home. We need to keep track of download fees when underway, which could be tied to file size or air time, depending on your system, SSB or sat phone.

You can do this with any of the scatterometer data fields that are available at the site listed (ASCAT B or C), but for offshore use you need to plan this ahead on some level so you know the file names that will cover your route.

Note added Aug 3, 2018
Our new textbook Modern Marine Weather 3rd ed (July 2018) now includes a graphic index to these image map files, worldwide. With that index in hand, you do not need to go online to discover the file names needed.  This technique from 6 years ago, however, still remains valuable, and we give it more emphasis in the text. Previously, it was only presented here. 

On the other hand, we can now get ASCAT data in GRIB format, and several viewers are capable of displaying it: LuckGrib (Mac and iOS), Ocens Grib Explorer (PC and iOS), and Expedition (PC). Data sources are covered in our textbook.

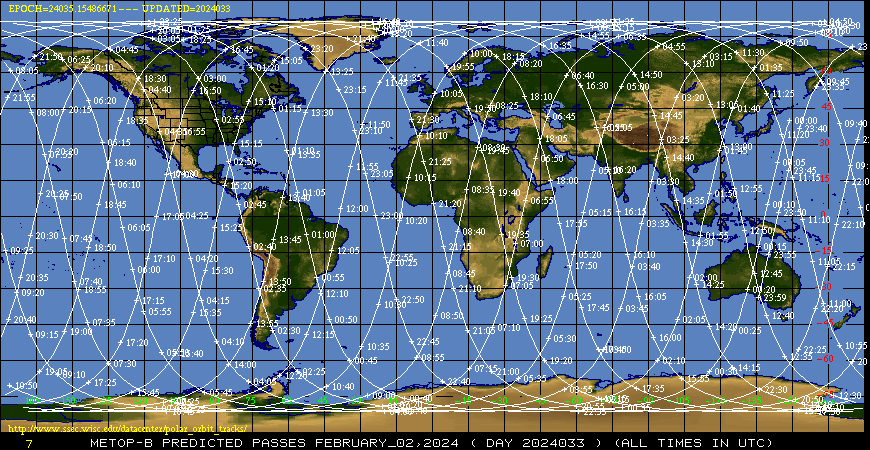
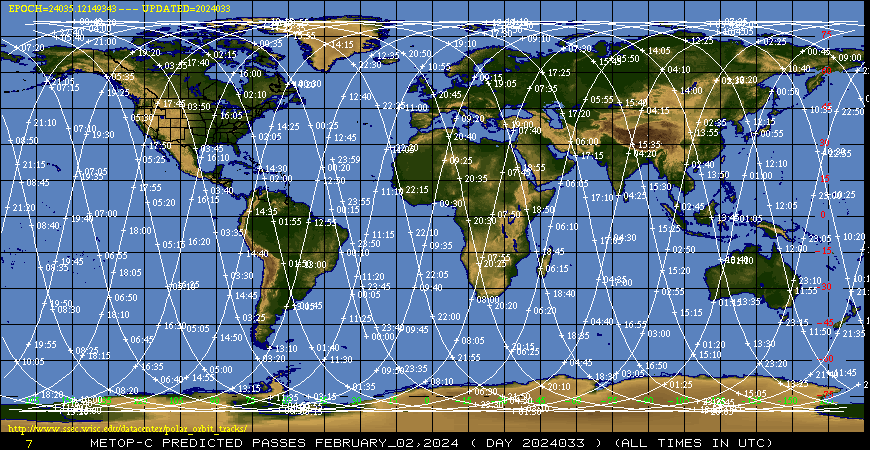
To get plots of the tracks online or by email request from saildocs, use this form of URL


Where these samples are for Feb 2, 2024, which is the 033rd day of the year. This  has to be figured or looked up and added. You can get these data for the present date and then 3 days in advance, ie on Jan 30, you can also get Jan 31, Feb 1, and Feb 2


Tuesday, July 31, 2012

The Buys Ballot Law

Below is the text of the paper where Christophorus Henricus Diedericus Buys Ballot first presented his famous law on wind and pressure in an English publication in 1863. The first appearance of this law in French was 1857. You will see that he was then Director of KNMI, which is still a world leader in meteorology research and the folks who bring us the ASCAT data.

There are several new ideas in this publication. First it appears he is proposing to carefully measure the elevation of the barometer above sea level and take that into account, which he suggests is not done properly in the past.

Then he compares the pressure reading with a value he computes for that elevation, which appears to be based on an average value for the date at hand. The difference between the measurement and the average value he calls the “departure.” Above average he calls Positive (equivalent to Highs) and below average he calls Negative (equivalent to Lows). This is effectively a calibrated atmospheric pressure, and as such the elevation of the instrument is crucial.

He then states his famous law. Namely that wind will not be blowing from High to Low pressure, but perpendicular to the line between them. He states that if Higher pressure is north of you, label the wind East and if Low pressure is north of you, label the wind West. This is all new territory for people at the time. Namely, how to correlate the wind direction with the pressure observed. Note too that he is naming the direction the wind comes from.

Then he tells us how to remember this: When you “place yourself in the direction of the wind” (ie wind on your back), then the direction to least pressure is on your left. He goes on to say that this is the direction of the greatest decrease in atmospheric pressure, which we often over simplify when we reword it as “pointing to the Low”.

These days we see the law with wind on the face and wind on the back, but if we stick to history it is best to use the law with wind on the back.

And he goes on to tell us some early estimates of geostrophic wind speed (in his own sort of way), namely if the pressure difference between his north stations (Den Held and Gronigen) and his southern stations (Vlissinger and Mastrich) is less than 4 mm of mercury (which is 5.3 mb) then the wind will be less than 30 pounds force on a square meter surface.... which are strange, mixed units to modern readers, but this is the way they described wind speed in those days. Note too they were all using mercury barometers in those days, which is only right as the then new (and very popular) aneroids were not nearly so accurate nor dependable.
We have not used these units in our weather course or in Modern Marine Weather (but we do include a frontispiece illustration of the idea in the book, shown above), so this will take some conversion. You can use the units converter from our Weather Trainer Live for the details. Use one of the online glossaries to look up “wind pressure” to find that the force of the wind per unit area is given by Wp = ρ*V*V/2, or one half the air density times the wind speed squared. Wp is in units of Pascals, which are Newtons per meter squared, and V is in meter/sec. Thus you end up with Wp = 0.6 V*V, since density of air ρ is 1.25 Kg/meter cubed.

Assuming pounds and meters are the same now as they were then, we can convert 30 lbs = 133.44 N, which gives his corresponding wind speed of 14.9 m/s = 29 kts. That is, V = SQRT(133.44/0.6) = 14.9 m/s

If we look at a map of Holland below, we find that the average distance N-S between Den Held and Gronigen to the north and Vlissinger (Flushing) and Mastrich to the south is about 113 nmi, thus he refers to a gradient of 113 nmi per 5.3 mb = (x 4/5.3) = 85.3 nmi (1.4° Lat) per 4 mb at latitude 52N. From Table 2.4-1 in Modern Marine Weather we would expect a wind of 0.8 x 40 /(1.4 x sin 52), which equals—quite remarkably—29 kts!

Below is our OCR of a hard-to-read copy of the original paper, 
with a graphic we added to clarify the text.

Report of the 33 Meeting of the British Association for the Advancement of Science
Aug and Sept, 1863
 
On the System of Forecasting the Weather pursued in Holland
 
Professor BUYS-BALLOT
Director of the Royal Netherlands Meteorological Institute.

In the plan pursued in Holland, observations are taken at four principal places: Helder, Groningen, Flushing, and Maestricht. On the indications afforded at these places the forecasts are based.

For every day of the year, and for every hour of the day, I have very carefully determined the height of the barometer in the place of observation at that height above the sea where it is suspended. This is a cardinal point not sufficiently observed in England, and not at all in France. The difference of an observed pressure from that calculated on, I call the departure of the pressure—positive when the pressure is greater, negative when it is less. Those departures, besides the observations of the other instruments, are communicated from post to post.

The rule is now very simple. If the departures are greater (more positive) in the southern places than in the northern, greater at Maestricht or Flushing than at Groningen or Helder, the wind will have a W. in its name ; when the departures are greater in the northern places, the wind will have an E. in its name.

More accurately, you may say, the wind will be nearly at right angles with the direction of the greatest difference of pressures. When you place yourself in the direction of the wind (or in the direction of the electric current), you will have at your left the least atmospheric pressure (or the north pole of the magnet).

When the difference of pressure of the southern places above the northern is not above four millimeters, there will be no wind of a force above 30 1bs. on the square meter. Moreover, the greatest amount of rain will fall when the departures are negative; and, at the places where the departures are most negative, there also the force of the wind will be generally stronger.
Moreover, there will be no thunder if the barometric pressure is not less than two millimeters above the average height, and when at the same time the difference of the departures of temperature is considerable.

These rules, and especially the first two, were laid down by me in 1857, in the Comptes Rendus; and on the 1st of June, 1860 the first telegraphic warning by order of the Department of the Interior was given in Holland. It was unfortunate that those telegraphic warnings were not introduced four days sooner, for in that case the first communication would have been a first warning against the fearful storm of May 28, 1860, called the Finster-storm.

All of you know how amply Admiral FitzRoy has arranged the telegraphic warnings all over England. The rules used in Holland have answered well, as is shown in the translation of a paper by Mr. Klein, captain of a merchant-ship, whereto I have added my observations and signals compared with the signals of Admiral FitzRoy. My own paper dates from June 1, 1860, and is extracted by Mr. Klein; but I preferred that the less complete and precise paper of a practical man should be translated, because I thought that the seamen would put more reliance on it. From the tables added to that translation, it appears that I have warned from my four stations just as Admiral FitzRoy has done from his twenty.

It must, however, be recorded that, besides those four stations, there are also some stations—Paris, Havre, Brest, in France, and Hartlepool, Yarmouth, Portsmouth, Plymouth, in England—that send me their observations. Generally they arrive too late; and therefore they throw very little light on the forecasting.

For the future, the normal heights of barometric pressure, or, better, of the barometers which are read, must be conscientiously taken; the observation must be made at more points once a day, and mutually communicated; and at days when there are greatly different departures—that is to say, of three millimeters—or when there is change of inclination, there must be sent a message at noon or in the evening of the same day. In all cases, not only the pressure in the morning, but likewise that at night should be given. A critical indication is when on the previous day the northern stations had greater departures, and on the following day the southern had greater departures, even when the difference in the latter case was small. A caution should be given when the difference of the departures is four millimeters.  [end of original paper]


Note we found the distance by taking difference between most north and most south city = 160 mi and then the two closest were 100 mi apart, then averaged to get 130 mi, and then converted to nautical miles.

Since Buys Ballot was so careful to stake out his publication dates, the only thing we add to these notes on this milestone paper in meteorology, is that the American mathematician William Ferrel actually published the prediction and theory of this effect a year earlier (1856), but this was not known to Buys Ballot. Ferrel proposed this law in the same paper where he was the first to ever apply the concept of the Coriolis effect to wind flow, which is fundamental not only to this law but to all of basic meteorology. He went on to many other remarkable achievements in meteorology and astrophysics. But if you did not read the Appendices to the Annual Reports of the US Signal Corps or an obscure medical journal in Tennessee, you would never know it.

Ferrel was, for example, the first to propose the method, essentially still used today, for reducing elevated atmospheric pressures to their equivalent sea-level values, which Buys Ballot also saw the importance of in this paper. You will find this little known gem in the same Signal Corps Report that tries to explain the Apache chief Geronimo's use of  smoke signals!

_________

We have elsewhere another illustration of the Buys Ballot principle intended to make it easier to remember.