Here is a summary of the models we would use
The last one listed is not really a model, but the National Digital Forecast Database, which is the digital form of the forecast made by meteorologists of the local Forecast Offices. The HRRR model actually goes out to 36 hr, but only for the runs at the synoptic times (hh=00,06,12,18z), and at least for now, none of the 3rd party providers are offering it. If needed, we can download it manually from here, using instructions from here. Sources of these hi-res files include Expedition and LuckGrib. Note that some third party sources of NAM and NDFD offer only the 12-km resolutions, which are not often suitable for regional work. If needed, we get the data directly from NOMADS.
One approach is to use the bottom three the night before to be prepared for what to expect on race or sailing day, and then start out with HRRR, updated throughout the day, checking NBM and NDFD periodically.
Checks along the way would be bouy or station reports along your route.... or spot checking the NDFD to see if they have changed the forecast.
As an example we look at an anticipated frontal passage, which is always a prominent event in local waters, because we anticipate a notable veer at the front that can have tactical significance.
Here is a an example from 2020 Toliva Shoals race that took place today in the south end of Puget Sound, which we looked at yesterday late afternoon.
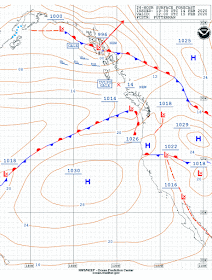
Based on the OPC surface analysis and 24 hr forecast, we anticipated a front crossing the course, possibly during the race.
Top is the analysis at 12z Fri (4 am PST); bottom is the 24h forecast valid Sat 4am PST. Race starts at 930 PST, so there is some chance the front will cross the course.
Further evidence of frontal passage sometime during the day is the local text forecast that showed S wind in the morning and W wind in the evening, and that veer (S to SW or W) is a hallmark of frontal passage.
We want to try to estimate the actual time of frontal passage so we can see how it might enter into the tactics. We do this here with the NAM model. A sample is shown below using LuckGrib. This forecast was made Friday afternoon (12z model run) and we advance it to start time at 930 PST Sat.
The NAM forecast for 930 PST Sat made at about 3 pm Fri using the then latest run, which was 18z. So this forecast for a midpoint on the course is represented by the meteogram below
We see in this Luckgrib meteogram that the NAM gives us a very good indication of when the front will come through. Fronts are always a trough, so they will be a local low pressure. In this case the pressure starts out at just over 1016 at the start (though notably higher earlier in the morning) and reaches a low of just under 1015, after which we see the pressure rise. This is a small drop of just 1 mb but perfectly detectable with a good barometer, which most mariners have in the phone in their pockets! Use our free Marine Barometer app, and read the instructions to get it set right.
And we see the veer, and indeed we see the rain. This is a warm front, so we expect the rain to just slowly increase then stop when the front goes by, which it does.
So even though all the signs are weak ones, this is a textbook example of seeing when a front is forecasted to pass, along with the sharp veer in wind direction it brings.
For comparison in the popular Expedition navigation program, below are the same data presented in the excellent meteogram option from Expedition
Expedition also has a nice option for a table view of the meteogram data, which in turn can be exported as csv.
In the actual race, the winds were notably stronger than forecasted the day before (especially at the southern wind funnel at Nisqually Delta, where it really piped up), and the boat finished the 38 mile course before the front came through. But it must have just missed it.
Here is the pressure record from the navigator's phone using our baro app.
The pressure drop was slightly larger (2mb) and it looks like it bottomed out a bit earlier than 4 pm but all in all fairly close for such an inland detail, predicted 24 hours out. This also shows how you can use your phone barometer to check the timing of such systems.
_______
Here is a second example, found at the moment from the latest national weather map, of a frontal passage over Lake Superior. (Not necessarily the best example, as we have so many excellent weather sources dedicated specifically to the Great Lakes.)
This is a section of the 18z analysis 2/15 with a blue line I added showing where the front was depicted on the 24h forecast, valid at 12z 2/16 which was made at 12z 2/15.
The front is predicted to move as shown in 18h, and Lake Superior is right in the middle, so we expect a front crossing the Lake at about 18z 2/15 + 9h = 03z on 2/16.
This is the NAM run from 18z showing the front approaching the west side of the Lake at about 03z and then reaching the other side about 06z as seen below.
In both of these maps we can also see the trough in the isobars that mark the front, but these pics are cut off too much to show it.
The main goal is to show how to use NAM CONUS and the other 3-km models to anticipate frontal passage and other details of interest to sailors. In each case we also see how the pressure pattern can help us anticipate where we are in the transit based on accurate measured pressures... and the valuable role of a meteogram presentation of the data.
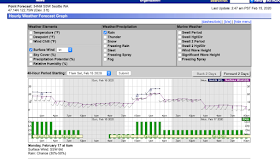
We can also get this from the NOAA presentations of the NDFD data. A sample is below. I will come back with more details of this source later on.
This is for a second front over the South Sound, viewed from the NOAA weather page, which is pure NDFD. We see the veer and we see the rain, but unfortunately, the NDFD does have pressure.


No comments:
Post a Comment