First we go over a bit of background and then show how you can create neat plotting sheets using the new NOAA Custom Chart (NCC) app online.
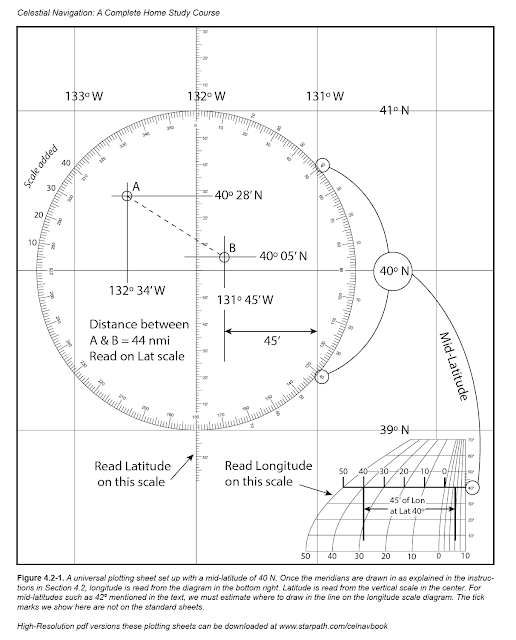
During an ocean passage it is very convenient if not crucial to keep a paper plot of your position as you cross. This is true for a small yacht as well as it is for a large commercial ship or navy ship. The traditional solution for yachts have been to use Universal Plotting Sheets. They are about 13" x 13", spanning 4º of latitude. The user then sets up the meridians to match the latitude selected using a nomogram printed on the sheets. They were originally a DMA product No. VPOSX001, now long discontinued, although still available from third party sources. There are also numerous free PDF versions online.
These sheets have been and continue to be used to plot celestial navigation sights to find a position, and then the DR track of the vessel can be made right on these same sheets. In modern times, they are still valuable for plotting GPS positions and planning routes based on forecasted winds, even when cel nav is not in use.
There are other options for yachts to keep track of ocean position when cel nav plotting is not needed. See optional downloads in Item (30) at starpath.com/getcharts. We also have there high-res great circle maps of the world we made for mariners at Item (31) on that page. If you want to print any of these on larger paper, see our note on Printing NCC, which reviews costs and paper sizes.
The key issue with ocean plotting sheets is: do you need to analyze cel nav sights, or not. If you need cel nav plotting then we need sheets that can be expanded to a large scale, just a a couple hundred miles across. This can be done on any size vessel using the Universal Plotting Sheets shown above, but for ships with large chart tables and large budgets there are other options... and with that, we tiptoe into the topic at hand.
You can buy blank charts of the ocean on real chart paper at real chart sizes. There are two NGA series of Position Plotting Sheets that cover these; they are available, purchased individually, at official print on demand (POD) printers such as Maryland Nautical, Paradise Cay, or EastView Geospatial.
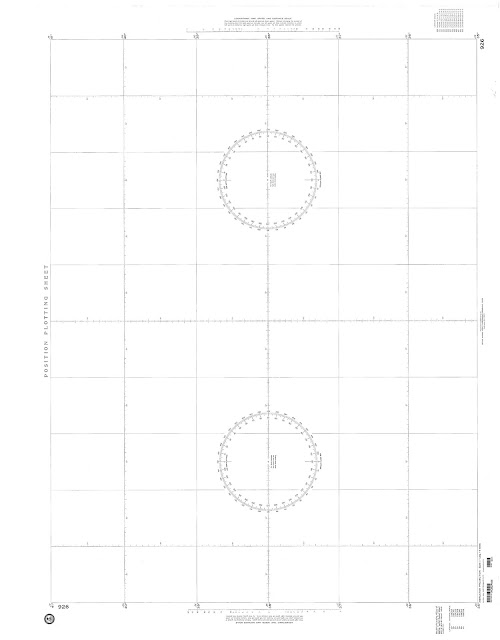
The first style (part number WOBZP9xx) are just blank charts. You choose the Lat range and the charts are labeled with those values, which sets the miles scale, and then you fill in the Lon lines you want. The sheets are 36" x 48". This series has 16 charts, numbers 920 to 936.
A sample is shown below.
Figure 2. An NGA WOBZ Position Plotting Sheet WOBZP926. Recall you can zoom for details, by clicking the pic, then right click, open in new tab, the zoom.An index of WOBZ options is shown below:
No. ( Latitude) Mid Lat Scale = 1:x,xxx,xxx
920 (4ºS to 4ºN) 0º 1,095,679
921 (3º to 11º) 7º 1,087,566
922 (10º to 18º) 14º 1,063,344
923 (17º to 24º) 20º30' 1,026,715
924 (23º to 30º) 26º30' 981,220
925 (29º to 36º) 32º30' 924,1984
926 (35º to 41º) 38º 864,517
927 (40º to 46º) 43º 802,596
928 (45º to 50º) 47º30' 741,597
929 (49º to 54º) 51º30' 683,493
930 (53º to 57º) 55º 629,889
931 (56º to 60º) 58º 582,040
932 (59º to 63º) 61º 532,576
933 (62º to 65º) 63º30' 490,222
934 (64º to 71º) 67º30' 841,029
935 (70º to 75º) 72º30 660,992
936 (74º to 78º) 76º 531,840
Recall that a chart scale of say 1:80,000 means that 1 inch on the chart corresponds to 80,000 inches on the land it covers. In a standard universal plotting sheet we have 3" on the sheet = 1º of Lat, and 1º of Lat = 60 nmi x 1852 (m/nmi) x 100 (cm/m) x (1/2.54) (inches/cm) = 4,374,803 inches.
So 3" on the sheet = 4,374,803 inches, so the UPS scale = 1:1,458,267. We see that these WOBZP9xx plotting sheets have a larger scale by about a factor of 2 to 3, which makes sense since they both cover 4º and one is about 3 times larger.
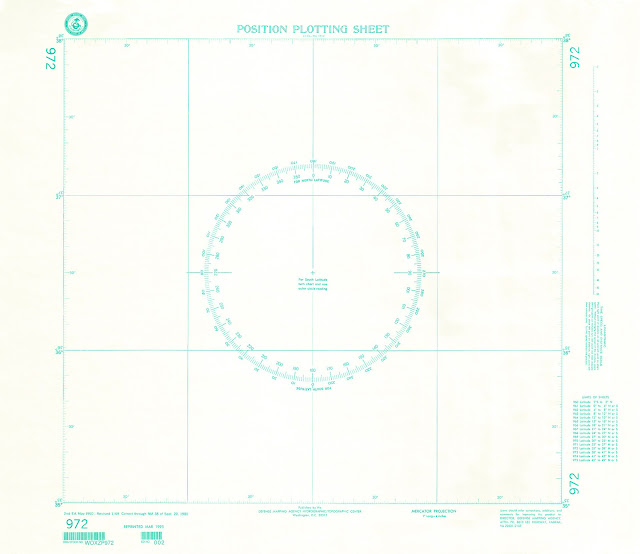
The other series of NGA Position Plotting Sheets (Series (WOXZP9xx) are a bit like an oversized compromise between the NGA plotting sheets shown above and the Universal Plotting Sheets. A sample is shown below.
Figure 3. An NGA WOXZ plotting sheet WOXZP972.
Below is an index of sheets available in this series (also 16 options, numbered 960 to 975). Except for the first one, each is set up for N or S latitudes. These charts are printed on 20" x 36" paper but active part of the chart is about 20x20. We are told the the US Power Squadrons use these sheets in their cel nav courses.
960 LATITUDE 2N to 2S
961 LATITUDE 0 to 4
962 LATITUDE 4 to 8
963 LATITUDE 8 to 12
964 LATITUDE 12 to 15
965 LATITUDE 15 to 18
966 LATITUDE 18 to 21
967 LATITUDE 21 to 24
968 LATITUDE 24 to 27
969 LATITUDE 27 to 30
970 LATITUDE 30 to 33
971 LATITUDE 33 to 37
972 LATITUDE 35 to 38
973 LATITUDE 38 to 41
974 LATITUDE 41 to 45
975 LATITUDE 45 to 49
Again, both of these NGA plotting sheets styles can be ordered from any POD printer. They are purchased individually, on good chart paper, and sell for $12 up to $26 depending on item and source.
_________
Now we get to the fun part!
When NOAA announced the discontinuation (sunsetting) of traditional paper charts, they also announced an intriguing new way that mariners can make their own paper charts, covering the regions they care about. The program is called NOAA Custom Charts (NCC). It is still under development with a few notable issues to be resolved, but I am confident that by the time these are our only option for any paper chart (December 2024) they will in fact be superior to the traditional paper charts we are accustomed to.
The key point for our present interest is the fact that we can define the scale we want and the location we want to cover, plus we can control what details of the chart are shown. For plotting, we will shut off as much of the chart info as we can, and then choose a scale convenient for either cel nav plotting or ocean tracking.
Below is an example made—at a student's request—for the waters west of Puerto Vallarta.
Figure 4. Plotting sheet made with the NOAA NCC app. The compass rose has been added.
When you make the sheet (chart) it will not have this compass rose on it, but you can add one if you want by downloading this file Compass_Rose_for_plot-sheet.png, which has a transparent background. Pasting images into a PDF is easy with Adobe Acrobat, but takes takes special steps using free apps from Mac or PC. Depending on what plotting tools you use, you might not need a compass rose (ie triangles or Weems plotter do not need one.)
We have a video on How to make the NCC (27:19) and, again, we have an article on How to Print NCC on big paper.
Another way to make a plotting sheet is to print the screen from a favorite nav program viewing base map only set to the region you want as shown below.
Figure 5. Plotting sheet made from exporting the screen of a nav program. This is from the free program qtVlm. You can also do the same from the free program OpenCPN. For this method, you might want to mock up a lat-lon interpolator scale. Graphic tools for changing colors once the image is captured are helpful. In the above we turned the dark blue ocean to white, and the while lines to gray.
Post comment/questions here as needed. As time or need arises, I can add a video on this process of making plotting sheets with NCC app.


No comments:
Post a Comment