Sunday, November 30, 2014
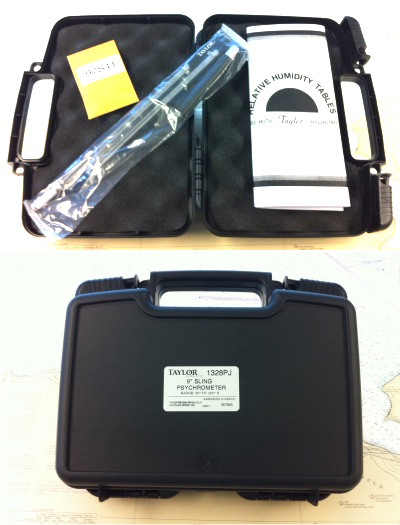
Taylor 1328PJ Sling Psychrometer — a Review
Relative humidity (RH) is a tricky measurement, primarily because it is so sensitive to the air temperature. One of the most basic measurements of RH is also one of the least expensive, namely a sling psychrometer. It has two identical thermometers one that remains dry (dry bulb) and the other covered by a clean cotton wick that is made wet with clean fresh water. Both are mounted on a swivel that can be swung about for the purpose of increasing the rate of evaporation of water on the wick.
Since the process of evaporation takes energy it cools the water, wick, and the thermometer inside it as the water evaporates; the more the evaporation, the more the cooling. But there is a limit, and that limit depends on the evaporation rate and that rate depends on the relative humidity of the air that is being evaporated into. Thus the suppression of the wet bulb thermometer temperature compared to that of the dry bulb thermometer is a measure of the relative humidity of the air at the dry bulb air temperature.
We have tested several of the these Taylor units. They are well made and a nice compromise in price, size, and accuracy. The list price is about $180 these days, but generally you can find them notably less... and I have seen then on eBay called new for well under $100.
Range 20°F to 120°F
9" Permacolor™ filled thermometers
Temperature accuracy ± 0.2°
Folding swivel handle
Hard plastic protective case (about a 12 " wide)
6 replacement wicks
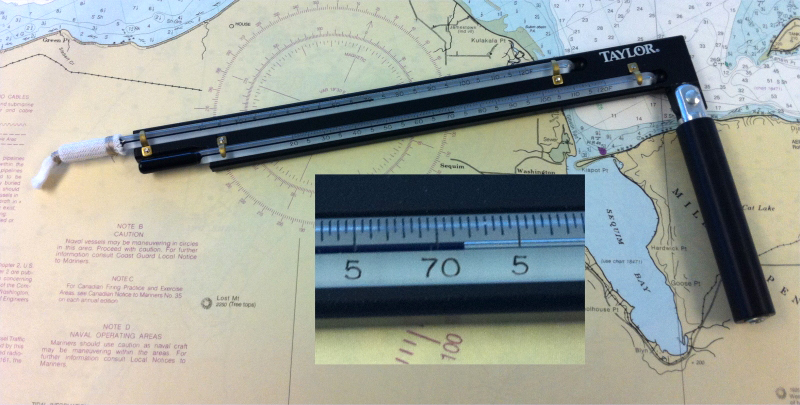
 The instrument is used by wetting the clean
wick with distilled water, then swirling it around for about 30 seconds
or more (rather vigorously) and then reading the wet bulb and dry bulb temperatures. With these
values you can look in tables (included with the device) to learn the
dew point of the air and its relative humidity.
Or go to this link to find both RH and dew point from the two temperatures: www.starpath.com/calc. Dew point is of more interest to navigators as it tells us how far we are from fog, whereas RH is of more interest to human comfort and how other things like violins and cigars interact with the atmosphere. Also for optimum espresso you have to change your grind number by 1 or 2 with RH changes between say 40 and 70.
The instrument is used by wetting the clean
wick with distilled water, then swirling it around for about 30 seconds
or more (rather vigorously) and then reading the wet bulb and dry bulb temperatures. With these
values you can look in tables (included with the device) to learn the
dew point of the air and its relative humidity.
Or go to this link to find both RH and dew point from the two temperatures: www.starpath.com/calc. Dew point is of more interest to navigators as it tells us how far we are from fog, whereas RH is of more interest to human comfort and how other things like violins and cigars interact with the atmosphere. Also for optimum espresso you have to change your grind number by 1 or 2 with RH changes between say 40 and 70.
By plotting dew point and temperature as a function of time you can often predict when fog will form. Accurate sling psychrometers like these can also be used to calibrate hygrometers that read the relative humidity directly on a dial.
Here is a quick test of 4 Taylor units showing the dependability of the thermometers. The wet and dry bulb temperatures should be identical for all units on a given time when sitting side-by-side at rest, out of breezes, and on a uniform temperature base. Also keep in mind looking at the dial, that tenths of a degree must be estimated. These were read using a magnifying glass, being careful to avoid parallax errors, and being careful to not get so close to the thermometer that radiant heat from your own body does not change the reading, which is a real concern, because the result is sensitive to tenths of a degree. Clearly they are all well within the specs given by Taylor. This is a crucial condition, because the accuracy of the humidity and dew point results are a direct computation from the temperature data. (Unit 4 was sold on Day 2.)
 We only have these data at this temperature, but from this the instruments look good, and we have used our in-house model for several years.
A few related, random notes:
(1) There are devices like this that have reservoirs for the wick water and fans that blow on the dial (ie do not have to swing them) and some have even more accurate thermometers. These are called Assmann aspiration psychrometers. Good ones cost $1000 to $1500. These units can get RH to about 2%.
(2) RH can be measured directly, either electronically or mechanically (based on the fact that how much human hair stretches depends on the RH).
(3) Electronic units that read RH directly and cost less than $100 or so, probably do not work.... ie compare 5 or 6 side by side and they will differ by 20 to 40%. Even ones that cost $1,000 have to be calibrated every year or so.
(3) Hair hygrometers can be human hair (works all temperatures) or synthetic hair, works above freezing. The Fischer Precision Instrument Company that is famous for high quality barometers receives the same high esteem worldwide for their hair hygrometers. Synthetic hair takes less maintenance. Always get a matching thermometer to sit beside it as you must know both numbers to do anything with the results. ie, to say the RH is 40% does not tell you much about the conditions of your atmosphere without knowing what temperature that was. Fisher hair hygrometers (model 122.01) cost about $60 and yield about 3-5% accuracy... all such instruments must be calibrated at some point. Matching thermometer (model 117.01) costs about $40.
(5) I must also add that we have not tested less expensive sling psychrometers. It could be that some that cost much less will also do the job. They key issue is are the thermometers identical and how accurate can you read them. In principle you could make your own from two thermometers and just blow a fan on them. We have done that with our Taylor and that works fine.... if not better than slinging it around. The wicks are easy to find online. You might call that one a half-Assmann model.
In short, a device like the Taylor model above is a good solution to many needs for accurate RH... or as a way to calibrate a good hair hygrometer.
Since the process of evaporation takes energy it cools the water, wick, and the thermometer inside it as the water evaporates; the more the evaporation, the more the cooling. But there is a limit, and that limit depends on the evaporation rate and that rate depends on the relative humidity of the air that is being evaporated into. Thus the suppression of the wet bulb thermometer temperature compared to that of the dry bulb thermometer is a measure of the relative humidity of the air at the dry bulb air temperature.
We have tested several of the these Taylor units. They are well made and a nice compromise in price, size, and accuracy. The list price is about $180 these days, but generally you can find them notably less... and I have seen then on eBay called new for well under $100.
Range 20°F to 120°F
9" Permacolor™ filled thermometers
Temperature accuracy ± 0.2°
Folding swivel handle
Hard plastic protective case (about a 12 " wide)
6 replacement wicks
By plotting dew point and temperature as a function of time you can often predict when fog will form. Accurate sling psychrometers like these can also be used to calibrate hygrometers that read the relative humidity directly on a dial.
Here is a quick test of 4 Taylor units showing the dependability of the thermometers. The wet and dry bulb temperatures should be identical for all units on a given time when sitting side-by-side at rest, out of breezes, and on a uniform temperature base. Also keep in mind looking at the dial, that tenths of a degree must be estimated. These were read using a magnifying glass, being careful to avoid parallax errors, and being careful to not get so close to the thermometer that radiant heat from your own body does not change the reading, which is a real concern, because the result is sensitive to tenths of a degree. Clearly they are all well within the specs given by Taylor. This is a crucial condition, because the accuracy of the humidity and dew point results are a direct computation from the temperature data. (Unit 4 was sold on Day 2.)
A few related, random notes:
(1) There are devices like this that have reservoirs for the wick water and fans that blow on the dial (ie do not have to swing them) and some have even more accurate thermometers. These are called Assmann aspiration psychrometers. Good ones cost $1000 to $1500. These units can get RH to about 2%.
(2) RH can be measured directly, either electronically or mechanically (based on the fact that how much human hair stretches depends on the RH).
(3) Electronic units that read RH directly and cost less than $100 or so, probably do not work.... ie compare 5 or 6 side by side and they will differ by 20 to 40%. Even ones that cost $1,000 have to be calibrated every year or so.
(3) Hair hygrometers can be human hair (works all temperatures) or synthetic hair, works above freezing. The Fischer Precision Instrument Company that is famous for high quality barometers receives the same high esteem worldwide for their hair hygrometers. Synthetic hair takes less maintenance. Always get a matching thermometer to sit beside it as you must know both numbers to do anything with the results. ie, to say the RH is 40% does not tell you much about the conditions of your atmosphere without knowing what temperature that was. Fisher hair hygrometers (model 122.01) cost about $60 and yield about 3-5% accuracy... all such instruments must be calibrated at some point. Matching thermometer (model 117.01) costs about $40.
(5) I must also add that we have not tested less expensive sling psychrometers. It could be that some that cost much less will also do the job. They key issue is are the thermometers identical and how accurate can you read them. In principle you could make your own from two thermometers and just blow a fan on them. We have done that with our Taylor and that works fine.... if not better than slinging it around. The wicks are easy to find online. You might call that one a half-Assmann model.
In short, a device like the Taylor model above is a good solution to many needs for accurate RH... or as a way to calibrate a good hair hygrometer.
Friday, November 7, 2014
Barometer for Wind Warning
There are numerous tactical uses of barometric pressure for safe efficient navigation, but here we take a quick look at just the basic one of using the barometer to anticipate strong winds.
In the picture below we see a classic case of wind rising with a pressure drop. We show this on the very nice combined display of wind and pressure shown on the NDBC websites, in this case for West Point Lighthouse (WPOW1), which is 1.6 nmi to the SW of Starpath HQ.
We see wind going from 5 kts to 32 kts in 9h... and in the first 6h of that it only went up to 15 kt, so really this is 15 to 32 in about 3h. This is something we would like to be prepared for as soon as possible. That 6h of watching the wind go from 5 to 15 is all wasted when we do not have a good barometer that could warn us that this wind increase could keep going on.
But even with a good barometer we still need a guideline to interpret what we observe. Our guideline is "4-5-6," meaning a drop of 4 or 5 mb in 6h is the sign to pay attention. This implies an average tendency (change in last 3h) of -2.0 or more.
In this example, we see a drop from 1025 at 12z on 5th to 1008 at 15z on the 6th, or 17 mb in 28h = 0.68 mb/h = 2.0 mb/3h. So the average drop rate in this example is plenty for a good warning, but once it starts down at this rate we still have to see this for 6 hours before the flag goes up.
Shown below the NDBC data, we have plotted the pressure tendency measured with a high precision NIST-traceable barometer here at Starpath. The scale on the left is pressure change in mb over the previous 3h. Looking above that to the pressure data, we see a drop from Point A (where the tendency first crossed 0.0) to Point B, marking 4 mb drop. This has dropped enough to keep an eye on, but not enough to conclusively trigger our 4-5-6 guideline because this took about 9h. After this point, however, you see an average tendency that is close enough to the 2.0 we need for a solid warning.
In other words, by the time of Point B, we should be fairly warned of strong wind potential. Thus we have (from B to C) about 18h warning that the wind we have watched increase to 15 is likely to increase notably more. Once we get to a tendency near 3.0 for a couple reports, we are beyond the forecasting zone; the strong wind is likely either imminent or present.
Starpath wind warning arrows
To help mariners take advantage of the accurate pressure measurements, we show below the pressure trend arrow conventions we recommend to all barometer mananufacturers. These offer a quick graphic view of the trend, which are scaled to match our strong wind warning guideline (4-5-6). The definitions are shown below.

With these definitions, keeping in mind our 4-5-6 guideline, we can make a shorter summary.

These arrows should be updated continuously on the dial face after the unit has been running for 1h, and with these we can anticipate the drop over the next 3h based on a projection of what we learned over the past 1h.
Note that the actual pressure tendency value that should be recorded with each pressure record is rigorously defined by the WMO and NWS as the pressure difference between now and 3h ago, so this value cannot be deduced until a barometer has been running for 3h or more.
The drawing below shows how these arrows would have shown up as the pressure dropped.
 Notice that the arrows would change during the short periods when the pressure flattened off during the drop, but the Fast Drop indicating real warning would dominate in this pattern.
Another point to stress is the pressure warning guideline assumes the wind is starting from light air. When the ambient wind is over 15 kt or so, as in the case to the left of this time period (3 days earlier) the guideline is not useful. In the open ocean, when the wind is above 15 to 20 kts to begin with, a rise in pressure often brings with it an increase of wind—most famously in the "sting of the scorpion's tail," which is the poetic description of a back bent occlusion. We see this behavior in the left-hand data for completely different reasons, but we are on inland waters here, effectively between two mountain ranges, so any standard pressure-wind forecasting can vary notably. Our guidelines were developed for the open ocean, but they are nevertheless a good guideline anywhere. As it turns out, the behavior seen here for this larger pressure drop is a fairly good example of what we might experience at sea.
Starpath data compared to NDBC data
In the pictures below we compare what we measured at Starpath compared to what we downloaded from the WPOW1 website. That instrument is located about 0.5 nmi form here. The agreement is very good. We actually have much more data in finer steps stored in our barometers, since we can only get data hourly from the website. Thus even with Internet access to this excellent data from the NDBC websites around the country, we still gain more resolution and earlier warning if you have your own precision instrument in hand.
In a later article I will discuss how precision barometers —even those in your phone — can be used underway for sailboat racing or cruising to predict wind changes on inland waterways. Then the precision and fine steps stored are especially valuable.

The red curve is from the Starpath calibration standard barometer. The blue from WPOW1. It has been randomly offset to show the comparison. Our instruments are located 5.8 mb above sea level. We see every small variation reproduced, which shows that such fine structure is indeed being created by subtle changes in the atmosphere, that at least cover a 1.6 mi radius, as that is the separation of the two instruments shown above.
We see even more interesting agreement on the tendency measurements at both locations. Again the red data is from an in house barometer; the blue from WPOW1.

In this case the elevation difference does not matter. Both instruments are just measureing how much the pressure has changed and their different elevations do not enter in. Here the scales and measured values are identical. Recording and plotting the tendency is valuable to ships who must report the pressure tendency with their regular weather reports back to the NWS. The detailed agreement and reproduced structure of the plot shows that this is indeed a measurable information that can help with forecasting and analysis.
In the picture below we see a classic case of wind rising with a pressure drop. We show this on the very nice combined display of wind and pressure shown on the NDBC websites, in this case for West Point Lighthouse (WPOW1), which is 1.6 nmi to the SW of Starpath HQ.
 |
| Top is wind and pressure from NDBC reports for West Point Lighthouse in Seattle. Bottom is the pressure tendency (mb change over the past 3h) measured with a precision barometer at Starpath HQ, 1.6 nmi away. |
But even with a good barometer we still need a guideline to interpret what we observe. Our guideline is "4-5-6," meaning a drop of 4 or 5 mb in 6h is the sign to pay attention. This implies an average tendency (change in last 3h) of -2.0 or more.
In this example, we see a drop from 1025 at 12z on 5th to 1008 at 15z on the 6th, or 17 mb in 28h = 0.68 mb/h = 2.0 mb/3h. So the average drop rate in this example is plenty for a good warning, but once it starts down at this rate we still have to see this for 6 hours before the flag goes up.
Shown below the NDBC data, we have plotted the pressure tendency measured with a high precision NIST-traceable barometer here at Starpath. The scale on the left is pressure change in mb over the previous 3h. Looking above that to the pressure data, we see a drop from Point A (where the tendency first crossed 0.0) to Point B, marking 4 mb drop. This has dropped enough to keep an eye on, but not enough to conclusively trigger our 4-5-6 guideline because this took about 9h. After this point, however, you see an average tendency that is close enough to the 2.0 we need for a solid warning.
In other words, by the time of Point B, we should be fairly warned of strong wind potential. Thus we have (from B to C) about 18h warning that the wind we have watched increase to 15 is likely to increase notably more. Once we get to a tendency near 3.0 for a couple reports, we are beyond the forecasting zone; the strong wind is likely either imminent or present.
Starpath wind warning arrows
To help mariners take advantage of the accurate pressure measurements, we show below the pressure trend arrow conventions we recommend to all barometer mananufacturers. These offer a quick graphic view of the trend, which are scaled to match our strong wind warning guideline (4-5-6). The definitions are shown below.
With these definitions, keeping in mind our 4-5-6 guideline, we can make a shorter summary.
These arrows should be updated continuously on the dial face after the unit has been running for 1h, and with these we can anticipate the drop over the next 3h based on a projection of what we learned over the past 1h.
Note that the actual pressure tendency value that should be recorded with each pressure record is rigorously defined by the WMO and NWS as the pressure difference between now and 3h ago, so this value cannot be deduced until a barometer has been running for 3h or more.
The drawing below shows how these arrows would have shown up as the pressure dropped.
Another point to stress is the pressure warning guideline assumes the wind is starting from light air. When the ambient wind is over 15 kt or so, as in the case to the left of this time period (3 days earlier) the guideline is not useful. In the open ocean, when the wind is above 15 to 20 kts to begin with, a rise in pressure often brings with it an increase of wind—most famously in the "sting of the scorpion's tail," which is the poetic description of a back bent occlusion. We see this behavior in the left-hand data for completely different reasons, but we are on inland waters here, effectively between two mountain ranges, so any standard pressure-wind forecasting can vary notably. Our guidelines were developed for the open ocean, but they are nevertheless a good guideline anywhere. As it turns out, the behavior seen here for this larger pressure drop is a fairly good example of what we might experience at sea.
Starpath data compared to NDBC data
In the pictures below we compare what we measured at Starpath compared to what we downloaded from the WPOW1 website. That instrument is located about 0.5 nmi form here. The agreement is very good. We actually have much more data in finer steps stored in our barometers, since we can only get data hourly from the website. Thus even with Internet access to this excellent data from the NDBC websites around the country, we still gain more resolution and earlier warning if you have your own precision instrument in hand.
In a later article I will discuss how precision barometers —even those in your phone — can be used underway for sailboat racing or cruising to predict wind changes on inland waterways. Then the precision and fine steps stored are especially valuable.
The red curve is from the Starpath calibration standard barometer. The blue from WPOW1. It has been randomly offset to show the comparison. Our instruments are located 5.8 mb above sea level. We see every small variation reproduced, which shows that such fine structure is indeed being created by subtle changes in the atmosphere, that at least cover a 1.6 mi radius, as that is the separation of the two instruments shown above.
We see even more interesting agreement on the tendency measurements at both locations. Again the red data is from an in house barometer; the blue from WPOW1.
In this case the elevation difference does not matter. Both instruments are just measureing how much the pressure has changed and their different elevations do not enter in. Here the scales and measured values are identical. Recording and plotting the tendency is valuable to ships who must report the pressure tendency with their regular weather reports back to the NWS. The detailed agreement and reproduced structure of the plot shows that this is indeed a measurable information that can help with forecasting and analysis.
Subscribe to:
Posts (Atom)