
Figure 1. SCAT stats with satellite id info needed for tracking. Data from China's National Satellite Ocean Application Service (NSOAS) instrument HY-2B is only available at KNMI/OSI-SAF.
The data index pages from the STAR Center for five instruments are shown below.


We see immediately that the wide swaths of the scatsat data are very attractive, but we need some confirmation that the data are dependable. One easy check is to see if they agree with the ASCAT data where there is overlap. The NWS highly regards the ASCAT data, which is used as input to model forecasts. A couple samples are below.


These two passes are about an hour apart, which is fairly close for this type of comparison. We see here very good agreement—also keep in mind the ScatSat is 12.5 km resolution compared to 25 for the ASCAT, so the details we see in ScatSat SW of Islas Marias could be real.
Another example:


These passes are at 0424 and 0451 respectively, which we read from the small purple times at the base of the diagrams.
Again we see good agreement and indeed we see the great value of the much larger data swath. Check out the Low in the bottom right, just missed in the ASCAT pass. We might even guess that this Low is moving north because of the stronger winds on the right-hand side.
And one more:


These passes are 0604 and 0451 respectively, 1 hr and 13 min apart. Not too bad for a rough comparison. We see wind directions good throughout and wind speeds seem consistent. The lower resolution ASCAT wind speeds are easier to read.
We can do a much broader comparison using a unique display tool at OSI SAF called Multi-platform Product viewer. This tool does exactly what we want. We choose a location of interest where there is ScatSat data and then with the tool we can look at all passes at about that time from the ASCAT instruments. Below is just one comparison off the coast of Perth, Australia, taken about 30 min apart. I will try to make a short video demo of the tool and post it here.

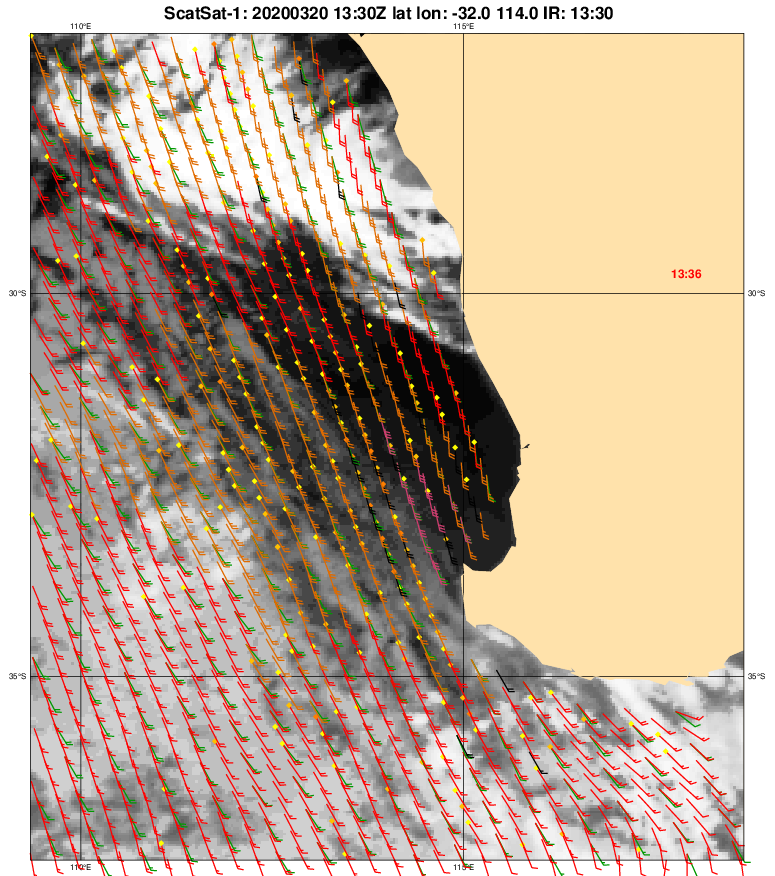
Wind speeds are a bit harder to read in the KNMI data as they include a cloud overlay and the color codes are tied to the Beaufort Force scale. The green arrows are the ECMWF model forecasts for the times of the satellite data, which is another neat feature of this display. We should not be too surprised by the general agreement observed as the ASCAT winds are used to seed the model runs.
In summary, this ScatSat data seems a boon to ocean navigation. You can get it the same way we get the ASCAT data underway with an email request to Saildocs. The key is knowing the file name to ask for. We have a graphic index to the file names in our textbook Modern Marine Weather. You can figure these on your own from the main index page at STAR Center. Just hover over a location to read the link. Then make a list.
The data images that cover the first 700 mi on the way from San Francisco to Hawaii would be this request to query@saildocs.com
send https://manati.star.nesdis.noaa.gov/sscat_images/noaa_cur_12km/zooms/WMBas38.png
send https://manati.star.nesdis.noaa.gov/sscat_images/noaa_cur_12km/zooms/WMBds38.png
This gets you the ascending and descending passes. When the images are full of data, the email is about 100 kB each. When empty of data, about 15 kB.
A good way to learn the value of this data is compare these images to the GFS or other models multiple times a day for several days. You will then be wanting to make your file list so you can ask for them at any time.
You can predict where the satellite will be using this link:

There are mobile apps and even screensavers that will track satellites that can be helpful.
Thank you India Space Research. Recall that we benefited from their OSCAT program for several years (2009 to 2014) when the amazing US QuikSCAT failed after a long and successful career.
[And a note of thanks to navigator Jeff Feehan, for directing me to the new Multi-Platform Product Viewer at KNMI, which was added here after the original was posted.]
__________
Note added Apr 7.
Since publication of this note, we have had two emails like the one below, indicating that the data are offline, and sure enough when this notice comes we do not see data at the STAR Center. In each case, we get another email the same day or next informing that the data are back online. So this is just a heads up that this is not an official source of data.
For what it is worth, the ASCAT data itself as obtained from the STAR Center is also described after all these years as still Experimental. But we have not seen outages of that data.
OSI SAF service message #2041
Sent on Tue, 07/04/2020 - 06:39 UTCTitle : ScatSat-1 winds unavailable
Message :
We are currently not receiving ScatSat-1 input data. The OSI SAF ScatSat-1
winds (OSI-112-a, OSI-112-b) are therefore not available. Note that you can
check the current processing status on
http://projects.knmi.nl/scatterometer/proc_status/ [1].
This service message has been published on OSI SAF web site :
http://www.osi-saf.org/?q=content/scatsat-1-winds-unavailable-32
This email has been sent to people who chose to subscribe to wind service
messages on OSI SAF web site.
You can update your subscriptions in your profile on http://www.osi-saf.org/
[1] http://projects.knmi.nl/scatterometer/proc_status/