Monday, March 18, 2024

A New Revolution in Barometers

We have worked for many years promoting the use of accurate pressure in marine navigation, which had literally fallen out of all standard texts on marine weather twenty years ago. The word "barometer" was barely mentioned. We would see occasionally that a falling barometer means bad weather, but nothing more, and certainly nothing about how fast it must fall for bad weather. And all of these books state—they are all still in print—that the value of the pressure does not matter; it is just a question of rising or falling, fast or slow, but never with any numerical values.

Accurate pressure was crucial in the late1700s and early 1800s when much of global marine weather was first learned and understood with the aid of accurate mercury barometers used at sea. But they were unwieldy and difficult to use and happily set aside with the development of aneroid barometers in the mid 1800s. That revolution took place without the full recognition that with the great convenience of the aneroids came a notable loss of accuracy over the higher and lower ends of the dial, which typically matter the most in routing decisions—a fact that has followed aneroid use into modern times. Thus began the doctrine that only the change in the pressure matters, not its actual value.

Now it remains as it was then: only the high-end, expensive aneroid units can be counted on for accurate pressures over the full range we care about in marine navigation. I would venture to guess that most barometers on vessels today are there primarily for traditional reasons, and not referred to for routing decisions.

We began our goal to change that with the first edition of Modern Marine Weather and had gone into the interesting history of how this came about in The Barometer Handbook. Both books show how important it is to know accurate pressure to evaluate numerical weather predictions that we ultimately rely on for routing. 


Accurate pressure is also often the fastest way to detect a change in the weather or the movement of a High pressure system we are carefully navigating around. Responding to the motion of a High is often a key decision for sailors in an ocean crossing.

In the tropics, where the standard deviation of the seasonal pressure is just a couple millibars (mb), we can know from accurate pressure alone whether or not a tropical storm is approaching—and we can know this before we see notable changes in the clouds or wind. Needless to say, we navigate in such waters primarily based on official forecasts and tropical cyclone advisories, but an accurate barometer gives us early notification that forecasted storm motions are on time, early, or late. On the other hand, any loss of wireless communications makes the barometer even more important.


In the hurricane zone between Panama and Hawaii, we would expect a July pressure of about 1012 mb, with a standard deviation of 2 to 2.8 mb.  A measured pressure of 1007 mb (2.5 standard deviations below normal) has only a 0.6% chance of being a statistical variation and a 99.4% chance of being an early tropical storm warning.  This type of analysis does not work at higher latitudes because the standard deviations are much larger.

Pressure statistics needed for this type of analysis are included in our Mariners Pressure Atlas.


We developed a sophisticated electronic barograph that was quickly adopted by the NWS for use on the voluntary observing ships  (VOS). We later sold that product to another company.


To further support the use of accurate pressure, we became the US distributor for the state of the art Fischer Precision Aneroid Barometer, used by those who want the best of the best in a mechanical unit, including the Navies, Coast Guards, and Weather Service vessels around the world, including the US. Fischer is one of the last sources for accurate, hand-made aneroid barometers.

To follow up on that, we developed both a free Marine Barometer app and low-cost Marine Barograph app for iOS and Android mobile devices. 


In short, we have worked on barometers for over 20 years now, but I felt we still did not have the unit that could have the biggest impact on marine navigation, which is what lead to the development of the Starpath USB Baro.

Not all vessels can invest in the high-end units. The mobile apps, while providing a convenient backup that can indeed broadcast pressure data to a navigation program, still rely on a device that must be charged and protected. Also running it full time does put a strain on the phone's battery life.

The New Revolution

Our goal was to develop a barometer that was first and foremost highly accurate and dependable, plus we wanted it to be easily portable. Finally, we wanted to produce it at a low enough cost to be attractive to all mariners, even those using it as a backup. For mariners we also need the output signals to be in the NMEA standard to match navigation electronics and software.

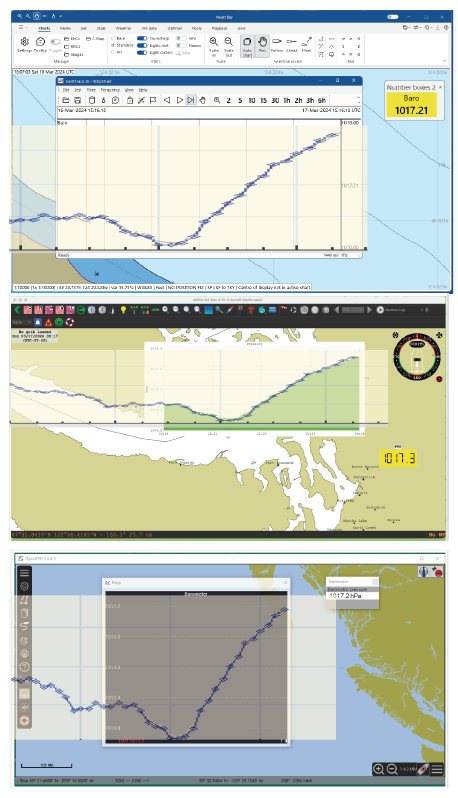
The result is the Starpath USB Baro for $49, which includes a metal transport case. It can be read in any Navigation program, or use our free USB Baro app for Mac or PC.

In stock and ready to ship from the link above.

Below shows how the pressure appears in three popular navigation programs. Video setup procedures for each are shown in the link above.


We can compare this with official pressure data from the West Point Lighthouse (NDBC WPOW1), which is 1.6 nmi from where the USB Baro data were accumulated.


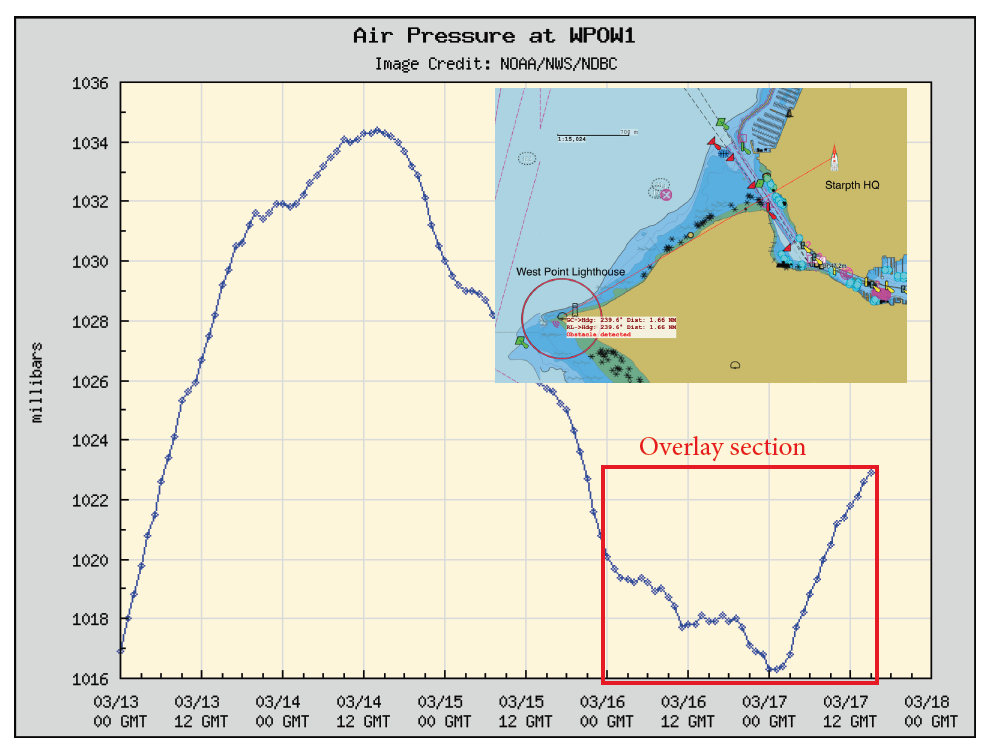
The red square marks the data corresponding to our measurements with the USB Baro. We can now overlay that data with what we measured, as shown below.


So, we see that with this simple device we have access to the same pressure data that NOAA relies on to make their official forecasts and numerical weather predictions.  

The difference between1023.0 mb indicated in the Lighthouse value and the 1017.2 mb observed in our office can be accounted for to the tenth of a mb, because of the elevation of the USB Baros compared to the sea level data from NOAA.  All of the Nav apps used offer the option to incorporate this offset so the instrument reads sea level pressure directly. Our free Marine Barograph apps made for the USB Baro also have that option.

Our Guarantee

If you have now a common aneroid barometer and then compare what it reads with the known accuracy of the USB Baro over a pressure variation of 30 mb or so, you will be very pleased to own the USB Baro. 

You will either show that your aneroid is accurate, effectively calibrating it, which otherwise costs $195, or you will learn that you did indeed need a more accurate source of pressure for your boat or home.

_______________

Below we see the same comparison between the official NOAA data from West Point Lighthouse and the USB Baro measurements using the free computer app, rather than a nav app.


Again we see the finest detail in the atmospheric pressure variation measured 1.7 miles apart being captured in the USB Baro and its free computer app for Mac or PC.

Thursday, March 14, 2024

Special Uses of the Star Finder and Sight Reduction Tables

The 2102-D Star Finder is essentially a hand-held planetarium designed for mariners to assist with celestial navigation. It can be used to plan the best sights as well as its main function which is to identify stars or planets whose sights have already been taken. We have devoted a short book to the many uses of this powerful tool called The Star Finder Book.

Sight reduction tables are permanent mathematical solutions to the Navigational Triangle that form the backbone of celestial navigation carried out in the traditional manner using books and manual plotting — as opposed to modern solutions using computers or calculators with dedicated cel nav apps.

There are several styles of these tables, popular versions are called Pub 229, Pub 249, and the NAO Tables, a copy of which is included in every Nautical Almanac. Complete free copies are available online as free downloads, which are good for practice, but do not make sense for use underway because any device that can read the files can also support a cel nav app that does the full process, sights to fix.

All sight reduction tables, regardless of format, do the same thing. You enter the tables with three angles and come out with two angles. We enter with the declination (dec) and local hour angle (LHA) of the object sighted and the assumed latitude (a-Lat) of the observer, and we come out with the angular height of the object (Hc) and its direction (Zn) as seen from the assumed position.

Put in plainer terms, the Almanac tells us where the sun and moon, stars and planets are located at any time of the year, and the sight reduction tables tells us what the height and bearing of any one would be as seen from any latitude and longitude.... or it tells us the object is below the horizon at that time and place.

The Star Finder does exactly the same thing, but with less accuracy. We look up in the Almanac a number that tells us how to set up the disks for the time and latitude we care about, and then we read the Hc and Zn of the celestial objects from the blue templates.

With that background, I want to point out that either of these tools can also be used to answer more non-conventional cel nav questions such as one that is part of our Emergency Navigation course. Part B of question 6 on quiz 5, asks us what are the conditions that lead to the sun's bearing changing with time at a rate of 45º per hour or faster?

This comes up in the context of using the "Eskimo Clock Method" to get bearings from the sun based on the local time of day, which makes the assumption that the sun's bearing moves along the horizon at the rate of 15º per hour. That condition, we show in the course,  requires the peak height of the sun at noon (Hc) to be less than 45º, which leads to the nick name "Eskimo clock," because at high latitudes the sun is always low.

Here we have a more specific related question, but it can be solved with the Star Finder or with sight reduction tables. 

We know that fast bearing changes means the object is very high and the fastest change will occur when the object passes overhead or near so. Consider sailing at lat 15º N during a time when the declination of the sun is also about N 15º (first few days of May).  [Note latitudes get the label following the value; declinations get the label preceding the value.] In this example, the sun will bear near due east (090) all morning and then change to near due west (270) in a matter of minutes as it passes overhead.  The question we have is, how do we specify the conditions that will lead to this bearing change being ≥ 45º/hr? It will have to be high, but it won't have to cross over head.

This could be worked from any latitude in the tropics, but we stick with 15º N, and look at the star Alnilam (declination about S 1º, which corresponds to the sun's declination in Sept, 19th-21st).  Below is the Star Finder set up for the time Alnilam crosses our meridian bearing due south.


Alnilam crosses the meridian bearing due south (180) at a local hour angle of Aries equal to 84.5º.  We see that the height of the star as it crosses is 74º, which we would expect in that we are at 15N and the star is at S1 so the zenith distance (z) is 15+1 = 16º which makes the Hc (90-z) = 74º. 

The rim scale corresponds to time at the rate of 15º/hr, so 30 min later (LHA Aries = 91.0º (84.5+7.5), we see that the star has descended very slightly but now has moved west.


Thirty minutes later the bearing is 205º, or 25º to the west of 180º. Thus if we imagine this star to be the sun in late Sept, viewed from 15º N, we would see its hourly change in bearing at midday to be about 50º per hour.  This is a bit faster than the exercise asked for, but we could experiment around for a closer answer.

We can also do such studies with sight reduction tables, such as Pub 249. We enter the tables with a-Lat = 15º and dec = 1º. With these tables we do not use North or South labels but just specify if they are both north or both south or is one north and one south. The former condition is called Same Name; the latter is called Contrary Name.  We have Same Name in this example.

We will also start with LHA = 0º, which means the sun is crossing our meridian (bearing 180), and like wise look at 30 min later with LHA = 7.5º. We could look at LHA = 15º, exactly one hour later, but the rate of bearing change at LHA 352.5º to 007.5º, as it crosses our meridian, is a bit faster than the full hour on either side.


In Pub 249, each Lat has a set of pages, LHA is on the side of the page, and declination is across the page. The tabulated values are Hc, d, and Z. The d-value is how much the Hc changes with 1º of declination — for Alnihlin, dec = S 1º 12', so we would reduce the tabulated Hc by 12/60 x 60 = 12' for precise values of Hc, but we can neglect Hc for present study.)

At meridian passage the bearing is 180º, then 30 min later (LHA=7.5), we see the body dropped from 74º high at the meridian to about 72º 20' at which time the relative bearing (Z) is about 154º, from which using the rule provided (Zn=360-Z) to find the new bearing of 206º, which agrees with what we found from the Star Finder.

These terms and procedures become more familiar with a full study of cel nav, but we hope the brief discussion of the principles show how these tools might be used for other questions. Note that LHA is defined as how far west of you the body is, so as it approaches from the east it has large, increasing LHA, which goes from 358, 359, 360, 1, 2, 3 as it crosses the meridian.


***