Friday, February 26, 2016

The Strange World of Electronic Chart Boundaries

This note outlines the subject and the questions it raises.
Later articles linked at the end present some of the answers.

There are two kinds of electronic charts of US waters, both free downloads from NOAA. Raster Navigation Charts (RNC) and Electronic Navigation Charts (ENC). There is nothing strange about the RNC. They are graphic images of the latest paper chart of the same name, with the same boundaries. When first getting into electronic charting, the RNC style is most likely the best to start with. The charts look exactly like the ones we are used to.

The RNC do have the advantage over their paper parents of always being the latest edition, never older than about 10 days.  We might be reluctant to spend another $28 or so on a new printed chart every time there are new editions or corrections, but with the RNC we can just click a button (when online) and it will be automatically updated in our navigation programs—at least in full feature programs such as Rose Point's Coastal Explorer.

Eventually, however, we will want to broaden our charting interface to include the vector displays of the ENC. There are several reasons for that. In some cases, there are no RNC counterparts at the scale we want. Also, in principle the ENC can include much more information because they include multiple layers of data. Not all versions include anywhere near their full potential in that regard, but it is possible, and also in principle these just get better with time. The land outlines and ATON detail improve with each new version. They too are updated about every 10 days or so, but like the RNC they actually change much less frequently than that.

That is not to say there are not drawbacks to the ENC. They call for new approaches to chart reading, and even though in use more than ten years now, they are indeed still evolving—and in the words of NOAA, sometimes "a little rocky." Nevertheless, they were just last week or so, approved as meeting chart carriage requirements on some vessels.

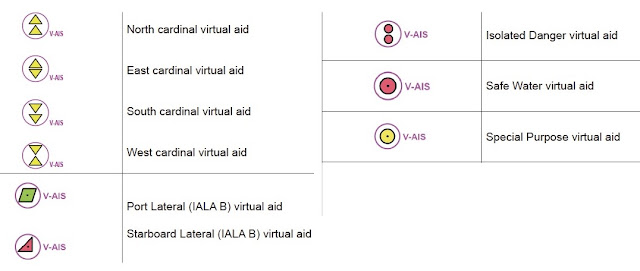
From the latest edition of Chart No. 1.

Another feature of ENC that could be an advantage to some users, while at the same time considered a drawback to others, is each user can redesign the layout. You can change the depth contours and water colors, show or hide various labels, choose optional symbol patterns, and change the style of boundary lines, among other things. Thus you can customize the look of the chart for special applications, whereas some users might consider that having invariant display standards is crucial to safe navigation when multiple navigators use the chart.

Beyond these pros and cons—subject for another article—there is a further call for ENC in that some tactical navigation programs whose main function is performance analysis and weather routing are often better run on the digital vector charts  (ENC or equivalent) rather than on the large image files of the RNC. In short, there are various reasons we might want to use the ENC.

And with that brief background, we come to the topic at hand.  The moment you decide to use the ENC for any reason, you discover a logistics issue that might not have been anticipated. Namely the chart numbering system defies immediate logic, and the chart boundaries are irregular at best.

The examples given here are for Puget Sound, but the points being made apply to any US Waters.

Suppose you want to look at the ENC equivalent of 18474, Puget Sound–Shilshole Bay to Commencement Bay. You will find this chart on the NOAA Interactive Catalog, ENC section, and it is called US5WA18M, and it is indeed described as equivalent to 18474, Puget Sound–Shilshole Bay to Commencement Bay. The actual ENC situation, however, is illustrated below.


We see that ENC chart US5WA18M (the green part alone in Figure 1) does not at all cover the same waterway. Furthermore, if you do want all the ENC charting that covers the waters of 18474 you will need 6 ENC charts. There must be some logic to the boundaries, but it is not obvious, nor predictable. Also, once these are all loaded into your program, it is only the US5WA18M that will describe itself (incorrectly) as "Puget Sound–Shilshole Bay to Commencement Bay." (We come back to the logic in a later note.)

Also the scales of adjacent charts do not match in the same way many RNC do. In RNC we often have a sequence of neighboring charts on the same scale, say 1:40,000 or even 1:25,000, but this is not the case with the ENC. The RNC of 18474 is 1:40,000. The ENCs that cover this chart area vary from 1:15,000 to 1:80,000.

With vector charts (ie ENC), however, the disruption going between adjacent charts of differing scales in a quilting display is not as often an issue as it can be in some RNC displays, so these scale differences are not a major issue, and indeed a virtue on some level.

Unlike RNC, there is much less likely to be any overlap between adjacent charts; they typically (not always) end right where the neighboring chart begins, but there can be ENC inserts, wholly within a smaller scale ENC chart.

But there can be other surprises,  as we see in this same type of comparison for RNC 18465, Eastern Strait of Juan de Fuca.
Figure 1. The ENC charts that cover the same waters as RNC 18474. Numbers in parentheses are what the ENC call the equivalent RNC.

Figure 2. The ENC charts that cover the same waters as RNC 18465. Note there is no US ENC coverage just south of Victoria. Numbers in parentheses are what the ENC call the equivalent RNC.

This is a popular sailing area in the Pacific Northwest, and waters of several yacht races. Here we see that that the waters of RNC 18465 is spanned by 8 ENC segments. The irregular blue section is the one NOAA calls equivalent of 18465. This is quite a hodge-podge, but rather worse than that is the waters of Victoria Harbor leading out to Race Passage is not covered by any of the US ENC charts.  Simply knowing that fact can save much puzzlement when using ENCs in this region.

The way around these issues in a basic chart program such as OpenCPN is to be sure to load all the ENC over the broad region you are sailing in. Then most programs will quilt and load these as needed, without you having to figure out which ones you actually need based on the chart name they present, which, as noted above, will not be logical very often.

This too points out a good selling point to look for when shopping for an echart program, especially looking forward to using ENC. A full-feature program will actually let you download the charts from within the program itself. Rose Point's Coastal Explorer, for example, has an especially nice way to do this by presenting to you the same ENC outlines you see on the NOAA Interactive Catalog.  So you can just click the ones you want, see them highlighted to confirm their coverage, and then install.

We cover the use of all echart formats in our online course on coastal navigation with illustrations using both OpenCPN and Coastal Explorer.

The video below shows how each of these programs end up presenting us with sometimes misleading descriptions of these ENC... at least until we learn more of the naming conventions.


— A special thanks to Tobias Burch for a nice solution to the graphics challenge of this note.

* * *

UPDATE 3/6/16.
Answers to several of the questions raised above have now been posted here:
Naming and Boundary Conventions on ENC eCharts.


Sunday, February 21, 2016

Great Lakes Wind Forecasts from HRRR

There are new weather sources available as of a  month or so, that have a big impact on marine weather of US inland waters across the country. Namely the HRRR model forecasts in grib format that we have discussed recently for waters of the Pacific Northwest. These data are available nationwide, so I want to highlight a few other regions starting with the Great Lakes.

The Great Lakes already have excellent forecasting, but I think this new data will add to even that. More  experienced users in that part of the world may know of better sources, but it seems to me one of the best is from the Great Lakes Coastal Forecast System (GLCFS). Below we take what we can get at this moment from that source. The GLCFS uses a model that is initiated every 12h, which makes it similar to the one at UW we discussed earlier.

Here is what we get going there now. [A video at the end illustrates the links.]

The Latest forecast as of 0400z is 4h old; the next surface wind report will be at 0628z, but that one (called Nowcast) does not have forecasts. The next forecast will be available at 1330z, which would be their 12z initialization. Thus it looks like it takes them 1h 30m to process the data and publish it, which is pretty fast.

Looking to other forecasts, we can compare that one to the free HRRR data online, from which at the moment we can get:


This data is 2h old. In other words, even though the model is run every hour, it takes about 2h to  process and publish the results. This too is not bad. Global models take up to 3h for maps of the ocean.

The other option I want to highlight here is we can get this same HRRR data from the commercial service of ocens.com, which offers this data in grib format via their WeatherNet service. It costs about $3 to download 15h of wind and pressure over the Lakes region. An example is below where the data were loaded into Expedition. The Ocens grib files should load into most grib viewers or echart programs that display grib files.


This is the same data we viewed graphically above, so it is also 2h old, but viewed in grib format it is much more detailed. Furthermore,  we at hand this way the full 15h of forecast, as shown in the video. We have more detail and we can read wind and pressure digitally at any cursor location. This can be compared to the free online view of the HRRR and GLCFS graphic data shown above. 

For actual checks of the model accuracy, it seems there is one buoy right in the middle of the south end of the lake (Buoy 45007), but that one is not providing data at the moment, so we look to the Chicago area. This could be even more interesting region to look at as we see that this forecast calls for nominally 5 kts (±2.5) from the NW, which is notably different from farther offshore. Viewing the data in a grib viewer, we can read the actual forecast and do not have to rely on the definitions of these wind arrow symbols. We can find the actual wind in Chicago at 04z (turns out to be about now) from the NDBC site for this Chicago station CHII2, where we find that this particular forecast is more or less spot on.  By the way, there is a really neat webcam showing conditions in this area.

There is every reason to believe that this HRRR forecast is the best available for the Great Lakes. It could be GLCFS and other sources of NWS Great Lakes forecasts are using it now, but it does not seem so from the above. Furthermore, even if they do use it for their 00z and 12z runs, the beauty of the HRRR model is it is run every hour with full assimilation of all observations over the past hour. In that sense it has to be by default superior to others for practical use.

Eventually we might have other sources of this data in grib format that will be available publicly at no charge. For now we thank Ocens for pioneering this presentation, which should help mariners across the country. Ocens does offer a free 3-day trial period for WeatherNet that can be used to download the data. We have a video on how to do this, which is good to check out when you have just 3 days to try it.

The video below illustrates the links above with a bit more annotation.


Saturday, February 20, 2016

Introduction to AIS

The Automatic Identification System (AIS) is a worldwide electronic navigation system designed to prevent collisions and to facilitate maritime traffic control and security. It was developed for commercial vessels, but any vessel can take advantage of this important service on some level. It is now a key component of the electronic instrumentation of all vessels, recreational and commercial.

AIS shows where all ships and other commercial vessels within VHF radio range are located—they are required to have AIS—as well as all of the other vessels who have chosen to add optional AIS transmitters. AIS signals broadcasted by each vessel and the frequency of the broadcasts:


Notes:
The navigation status terms are taken directly from the International Navigation Rules (COLREGS). The definitions are in Rule 3.

The dimensions of a vessel are entered into the AIS unit to be broadcasted in a unique standard format internationally. It is designed to convey both overall dimensions as well as the location of the GPS. All computations of closest point of approach are computed between the GPS locations of the two vessels. When up close on large vessels this can make a crucial difference.  When up close on large vessels this can make a crucial difference.


Length overall is A+B and beam is C+D. Nav programs like qtVlm let the input be feet or meters, but the actual values sent out in AIS signals are meters.

AIS signals are transmitted from vessel to vessel at VHF radio frequencies, same as used for voice communications. They are line of sight, so the heights of the antennas, as well as the transmitting power, determine the ultimate ranges.

You have two ways to take part: You can install a receiver alone to learn about traffic around you, or you can install a transceiver, to both see AIS traffic and broadcast your own AIS information as well. Both are optional for recreational mariners, but transceivers are mandatory for commercial traffic. Receivers alone cost $60-$300, whereas transceivers are in the $800 to $3,000 range. At minimum, an AIS receiver should be considered standard electronic navigation equipment on all recreational vessels. Reception alone is very easy to set up; some new VHF radios include AIS output as an option, sharing the same antenna. Transceiver set-up is required to be assisted by a certified technician.

There are a few simple, but important, basics: First, we need a way to display the targets. The higher end receivers include a display of text data (which is not so convenient if that is all you set up) and a graphic interface, but all receivers have an output in NMEA format. The simplest solution is input the NMEA signals to your electronic charting system (ECS). This might be some integrated package of instruments and display in a  console navigation package, or without that, you can run echarts on a laptop. AIS receivers have a USB output that goes directly into your computer. The free navigation programs OpenCPN or qtVlm, for example, have many versatile AIS display options, as do all commercial ECS programs.  

The display and functionality that you get for monitoring and interacting with AIS traffic will always be much enhanced using one of the free or standard commercial ECS than it will be in the stand alone AIS displays.

Next, there are two classes of AIS signal transmission: Class-A transmission is the higher-end type required on ships and other commercial vessels, and Class-B transmission, available to vessels not required to carry Class A. All AIS receivers display both A and B signals, so the equipment decision is mostly receive only or transmit and receive. Recreational mariners can choose Class-A or Class-B transmission. Class A transceivers offer higher performance, but they cost more, so the Class-B transceivers are more popular with vessels not required to carry Class-A.

Vessels required to carry AIS Class A include: all commercial vessels over 65 ft, towing vessels over 26 ft with horsepower over 600, vessels certificated to carry more than 150 passengers, most dredging vessels, and all vessels with dangerous cargo.

Vessels required to carry AIS Class B if they do not carry Class A include: fishing industry vessels, and some passenger vessels that do not use traffic lanes nor have speeds over 14 kts. Vessels that would otherwise be required to carry AIS, but whose operations are restricted to a 1-nmi radius, can apply for an exemption to the AIS requirement. Other previous exemptions to the carriage rules all end on Mar 1, 2016. Vessels required to carry AIS must turn them on not later than 15 minutes before getting underway.

In short, ships, tow boats, and most larger commercial vessels use Class A, as do some fishing vessels, but most fishing vessels and most recreational vessels will be using Class B. The Table below compares the broadcasting schedules. It includes a special form of Class B called B-SO (self organizing) which has higher power than Class B and more frequent reports for fast vessels. It costs more (see notes at the end of this article), so would only be of interest to vessels that routinely travel at speeds higher than 14 kts or especially those higher than 23 kts, in which case one is really better off with Class A.

Table adapted from our textbook Inland and Coastal Navigation

Note this nuance about reporting rates: Navigation status is part of the dynamic data that is updated at a rate that depends on the SOG of the vessel, but there is an exception for when the vessel is not underway, namely anchored or moored. When anchored or moored, dynamic data is sent out only every 3 min. Once underway, i.e., not anchored or moored, the broadcast rate goes up tremendously to every 10s—even if the vessel speed is still zero. The vessel operator must manually set the navigation status in the AIS electronics... or an app that can control them.  

There is a fine issued by the USCG to vessels who anchor or moor their vessels and leave the AIS on and in nav status "underway using engine," or anything else other than moored or anchored. The reason is at a broadcast rate of once per 10s all night and day as opposed to the proper once per 3 min they are using up AIS bandwidth unnecessarily, and in crowded harbors this can be an issue.

An example of the need for this is shown below.


This screen cap from qtVlm displaying our live AIS data (we are 0.7 nmi NW of here) shows multiple tooltip reports of dynamic data, where we can note the speed and that the navigation status has not been set properly. This app adds an anchor ball to vessels with speeds zero. The other anchored targets have set the nav status properly. Ironically, the local maritime police station is just up the waterway from here, so they can always turn on the blue lights and head out to top off the coffee fund.

AIS can also be of great assistance in basic chart navigation in that prominent aids to navigation (buoys, lights, bridge pillar marks, etc) often send out AIS signals that show up on your echart display in the proper locations (labeled ATON). 


Virtual ATON symbols from our book Introduction to Electronic Chart Navigation.


Collision avoidance is also greatly enhanced by AIS because most echart programs read the AIS dynamic data of the targets and they know your own COG and SOG, so they can compute and display for you the closest point of approach (CPA) and the time to the CPA (TCPA) based on present conditions. Then as either of you alter course, you watch how this changes.

Search and rescue operations have special AIS modes that locate vessels and aircraft involved. There are even small, personal AIS transmitters that you can carry and activate if overboard so you show up on all local AIS receivers.

AIS reception also enhances your radar watch in the ways listed below.

AIS Synergy with Radar

1. AIS can find and communicate with targets hidden behind land or around corners that radar cannot see, and then plots them on an echart as if seen by conventional radar.

2. A radar echo can be identified or contacted by vessel name and vessel class rather than using a generic hail.

3. Target interactions (CPA, TCPA) can be improved because the target vessel is broadcasting performance data such COG and SOG and even a rate of turn when turning.

4. Extended tracking range is obtained since VHF communications reach out farther than typical radar ranges and thus passing arrangements can be made long before the vessels meet.

5. Ship target intentions will be more clear, and will help with maneuvering decisions, because the target’s destination, ETA, cargo, draft limitations, etc. are broadcast along with other AIS data.

6. Some ECS radar displays and all commercial vessel radars have an input for AIS signals so they can display the AIS targets overlaid on top of the radar targets.

For completeness, we add...

Advantages radar retains over AIS for collision avoidance

1. Radar range and bearing are direct measurements, more "tangible" or "visual" to many navigators, compared to the "black box" digital reports from GPS or AIS that require external inputs, and thus a higher level of faith.

2. Radar data are instantaneous, whereas AIS always includes some level of delay.

3. Not all vessels carry, or have turned on, a transmitting AIS signal, and internet AIS are always much delayed, whereas radar works, even for a target vessel drifting with no power... or  log!

4. More remote an issue, but radar is essentially immune from spoofing, whereas the GPS that AIS depends upon is notoriously easy to spoof.

5. Radar being wholly self contained is independent of available public services needed by GPS and AIS.


There are numerous AIS sources online and in mobile apps that present near-live AIS signals for most waters of the world. In principle we could use our smartphone with a 4G connection to actually see the AIS targets around us when we are underway. This however, is not at all a dependable or safe approach. There is often a large delay between actual AIS reports and the ones we see in these apps, and this could lead to serious navigational errors.

A sample of AIS targets displayed in an echart program is in Figure 12.19-1, with a detailed view in Figure 12.19-2.


Figure 12.19-1
. AIS targets viewed in OpenCPN. Active or selected target is the one whose information is being displayed (marked with a square box), else the targets are called sleeping targets, which is misleading—they are sleeping only in that you have not chosen to read the data. Echart programs often have ways to annotate or color the symbols beyond the standard format. Projected vector lines show COG and SOG. The above are set to show 3-minute projected positions. Sometimes we can detect current when the true heading line is different from the COG. Destination information when present is more often wrong than right. This has to be manually updated and often gets overlooked.


Figure 12.19-2. ECS display can be set to show actual target size and precise location when zoomed in. On the right is our vessel, also scaled to right dimensions and precise location.  We can see that the target heading and COG are different. This is viewed with OpenCPN.


A simulated vessel interacting with 3 live AIS targets in qtVlm. This type of study is a unique feature of qtVlm. Here we see two tooltip reports of  CPA data and one Details report for the other target. The red glow around the collision risk targets grows and pulses as they get closer. (Click image, then right click to open in new tab, and zoom in to see details.)

____________________

These notes were adapted from our text Inland and Coastal Navigation, 2nd Ed. We will follow up with a report on several specific AIS receivers, including this neat unit that is made here in Ballard, a few blocks of Starpath HQ, called the dAISy. It is powered via the USB that connects it to your computer.


A dAISy with a ducky (not included). It does include an adapter to a standard antenna connector.
 
____________

See also our related notes:


References (We are lucky here, there are excellent references online.)


Added 4/6/22. Below is a nice summary of the comparison of Class A and Class B AIS from the excellent, well illustrated overview of AIS produced by Digital Yacht in the UK.


Added 8/21/22. Digital Yacht also has a good overview of Class B-SO, which they call B+. (Note Class B does not have an "anchored or moored" mode. They just mean here that a vessel with speed about 0 is 3 min.)  

Below is a comparison we made for relative prices of these models. 


The prices we found here are consistent with the summary from the USCG. Besides the extra power which would mean being seen a few miles farther off, the main advantage goes to vessels who routinely travel at >14 kts and almost required for those routinely going more than 23 kts, but in that case, the Class A would  be preferred.

In our live AIS receiver we have here at Starpath we see a fairly large number of B+ units, which might reflect that standard installs just default to that model, independent of its actual need.


Wednesday, February 17, 2016

Sailboat Racing on the Salish Sea—Part 1. Northern Waters

The Salish Sea refers to the combined waters of the Pacific Northwest. It is highly unlikely that any Salish native ever used the term in this sense, but there is enough interdependence of these waters and varied reasons to refer to them as a unit that the term has been adopted by the Geographic Boards of both the US and Canada. For our purposes at hand, we break this term up into Northern Waters, being the Strait of Juan de Fuca, the San Juan and Golf Islands, and the Southern Straits of Georgia, leaving the Southern Part to be made up of Admiralty Inlet and Puget Sound. Note that though we do agree with Canada on the name of this grand combined waterway, we do not agree on the name of the Strait of Juan de Fuca, which they insist on calling the Juan de Fuca Strait!

And I should also add, that the reason we break up the waters this way is because the University of Washington Department of Atmospheric Sciences produces their highest resolution numerical weather predictions on these two separate map regions.  Most local races are in one or the other of these Parts, but there are a couple notable races that sail between them, and those will give the navigator a bit more work to do.

The task at hand is to describe and compare the best possible wind forecasts for these regions. To my knowledge, the best forecast is from the UW WRF model, meaning that they start with the best regional model data and then add to that the best practical topographic and surface data.  This model is run twice a day, initialized at 00z and 12z, and produces graphic map forecasts, one per hour out to 60h. Thus when the 00z run is completed, the first valid time of the sequence will be 00z. Likewise with the 12z. The 6th map of the 12z sequence will be valid at 18z, and so on. But these computations do not run right at 00z or 12z; it takes some time for the assimilated data to get into the system, and then it takes some time to actually run the computations. On top of that, UW is running quite a few models on their computer, and the high resolution run we care about (1.33 km between data points) is the last of the set to run.

Consequently we do not get the 12z hi-res data online until about 00z the next day. Likewise the 00z data becomes available about 12z that day. In local times, we get the newest data each day about 4 am and 4 pm PST, and these data will then be 12h old when we get it. So what are in principle the best data are severely limited by being very old when we get it.

The Figures below show what the ocean maps look like over this region compared to the UW data for the same time. The global models used for the ocean data do not show any of the crucial structure to the isobars and subsequent wind patterns that are created by the shape and texture of the terrain.


Figure 1. Surface analysis from OPC.

Figure 2. UW WRF model prediction initialized at same time as the surface analysis above. This combines both UW maps they call "Northern Waters" and "Puget Sound"


To show how dynamic the patterns are over the inland waters, look at the animation below that shows how these maps evolve. We have highlighted a couple key isobars, because it can be difficult to identify the isobars in their maps. (Meteorology theorists do not have a proper respect for surface pressure. They should go sailing more often!)


Figure 3. Video showing how the UW-WRF model winds and isobars evolve hourly, along with notes on where to access the data.

* * *

As of a few months ago,  however, we now have a very attractive alternative or supplement to the UW data, thanks to the Seattle based ocens.com.  They now offer the High Resolution Rapid Refresh (HRRR) model data in grib format—NWS scientists, by the way, pronounce this abbreviation "her," and refer to this as "her-data."

You can see low-res presentations of the data online from the primary source (use domain = sea), but it is not as detailed as we would hope for in the format available there.


Figure 4. HRRR wind data for domain = sea, viewed online. It is not a hi-res presentation, but we can make rough checks.  The wind at Pt Townsend was 9 kt at 090 at the time of this map, which looks consistent. Buoy Juliette was 4 kts at 150, also consistent.
Figure 5. HRRR "surface pressure"  data for domain = sea, viewed online. BIG CAUTION HERE: What they call 'surface pressure' is actually station pressure, totally dominated by the elevation of the land, and no value at all to weather routing.  They do not seem to have mean sea level pressure online.  Again, we need more meteorologists going sailing.
For tactical use underway, we need these data in grib format so we can read digital values of wind and pressure. Then we can load the data into a program like Expedition that might give us useful route guidance, even on these inland waters. Thanks to Ocens we now can get just that.  The data they offer is a commercial product (there is a charge to set up the account, then a small fee for each download), so when racing we can only use it before the start.

Elsewhere I have posted video notes on how to download these data from Ocens using their WeatherNet application for both PC computers and for iPad. Their Mac products do not support this new data so far.  Refer to those links for the details. Even with an Ocens account there are a couple crucial nuances to actually finding and downloading it.

The Ocens HRRR data is packaged into separate wind and pressure files, with 3h of forecast in each grib file. So to get the maximum forecast of 15h of wind and pressure you will need to download a total of 10 files. Since the files are high resolution, you will want to set the Lat-Lon selection region as small as possible, not to mention that there is not much logic in larger regions for these local forecasts. They are also updated hourly with full assimilation of all observations at each new run.

The motivation for this model was to forecast tornadoes and thunderstorms, which accounts for the rapid refresh and high resolution. In fact, we have every reason to think that we could even forecast squall behavior on some level with this data.  Recall, though, this is only for US waters.

Static samples of what this HRRR data in grib format looks like is shown below, viewed in Expedition. Each download of the data provides 15 successive hours of this type of forecast, and that forecast model is updated every hour with latest information from all buoys, lighthouses, air ports, and radar, as well as from commercial aircraft flying over the area with observations of winds aloft that go into the model as well, with important influences on the surface winds and pressures.


Figure 6. HRRR data from Ocens viewed in Expedition. Top is Eastern Straits of Juan de Fuca, Bottom is central Puget Sound.
Though the focus here is Northern Waters, I pause for a quick look at Figure 6 in motion, because it shows what detailed forecasts we have now for all of our inland waters.

Figure 8. Video example of HRRR data in Expedition, also illustrating their meteogram function.

* * *

Now with that long introduction, we get to the main point at hand: How do we gather together the forecasts from these two sources (UW-WRF graphics and HRRR gribs) to make our own best guess of what will take place?

The most elemental approach would be to download the UW images of the most recent forecast that covers the race you care about. Then print out each page in color and put them in a notebook, carefully labeled with the valid times. Likewise, without further tools, you could print out the low res HRRR data from the images online. Not much detail there, but almost enough to check for consistency with the UW data.

But with due respect to all my good friends who use them, that would be a sort of flip-phone approach. We have more powerful tools now, and indeed Expedition is one of them, primarily because it has such a very nice image import function, which I have discussed in several videos: Part 1 describes the procedure, and discovers a good example of why we do this, and Part 2 optimizes the image display and introduces the NDFD grib view of the graphic forecast, and finally Part 3 uses the Expedition ensemble display to show how the GFS and NDFD begin to diverge as a front approaches.

With that technique in hand, we can now directly overlay the HRRR grib data on top of georeferenced images of the UW data. A static example is shown in Figure 9.

Figure 9. Static capture from the video of Figure 10, showing HRRR grib data from Ocens overlaid on the graphic forecast from UW. Black isobars and winds are the HRRR grib data. The blue line on the UW graph is a highway.  The agreement is pretty good in most areas. Although the isobars do not overlap very often, the actual pressure difference at any point is typically less than 1 mb and the general shapes are about right. See also notes to Figure 10 video.


The video of Figure 10 illustrates the process of getting the UW images into Expedition. This seems to me the best way we can study and compare these two models, with the not so hidden agenda of wanting to show that the HRRR data will be just as good in practice, because we can get that much easier and it is digital.

 Figure 10. How to import and georeference UW graphic forecasts and then overlay the HRRR data in grib format.  Use the color scale on the graphics for the UW wind speeds. Use the Tool Tip in expedition to read wind and pressure from HRRR.

To reproduce the georeferencing of these Northern Water maps shown in the Figure 10 video, you can cut and paste these values mentioned in the video:

     SW coast line = 47 44.660N 124 27.829W

     NW coast line = 48 42.278N 124 57.555W

     Foul Weather Bluff, NE corner = 47 56.423N 122 36.265W

In striving to find the best forecast, we have to keep in mind that a simple overlay of the latest data corresponding to the same times is not the end-all determination.  In fact, we cannot even make the comparison any time we choose.  Although we get new HRRR data every hour, the only comparison we can make with UW-WRF is at 00z or 12z, the initiation times at UW, at which times we can compare what each predicts for the next 15h.

Just a few hours later, however, we can get a brand new HRRR forecast for 15 hours, fully assimilated, but we will not get any new info from UW for 12h. In other words, even if the UW model happened to be better at one particular time, a few hours later the HRRR will be better by default, because it has all new inputs and there is no UW option until the next 12h cycle. Thus in rapidly changing conditions, the HRRR predictions have to win out—not to mention that the HRRR data are available for all US waters across the country, very few of which are lucky enough to have the excellent forecasts we get from UW.

The forecasts can be easily checked with the convenient index we have online at starpath.com/local.  Just look at the Observations pages for direct links to key points around the waterway.

When preparing for an actual race we would also want to fold in what the local NWS office is telling us in text forecasts. Then looking at the model forecasts we will better understand why they say what they say, and we will be able to better interpret those brief text statements, and greatly expand their  implications.  We have the text forecasts online as well in a very convenient format at our Zone Forecasts page.

When folding in the text forecasts for the Northern Waters you may notice that our Canadian friends are very conservative with wind warnings. This is a well known policy, so having these model forecasts at hand can often help in spotting the differences between Canadian and US wind forecasts for the same waters.

By "conservative" I mean that if their in-house predictions call for 15 to 20 with some probability of 25, they are more likely to call this 20 to 25, than the US counterpart might do.  That is not at all to say this is a bad policy, but it is just a known tendency that is valuable to keep in mind when making tactical interpretations of the txt forecasts.

When used for sailboat racing, I have to stress again, that the HRRR grib data is only available at present as a commercial product. It must be purchased and as such cannot be used during the race, but only up to the starting time.

Needless to say, however, this commercial data can be a great boon to all commercial maritime applications that need best possible forecasts, such as ferry companies and tow boat companies, as it could be for all recreational mariners who do not have rules on outside assistance.

To me, the availability of the HRRR data in grib format is the most important marine weather development for US inland waters that we have seen in many years, and we remain grateful to Ocens for making this pioneering step into this field.  For more widespread use in racing, we have to wait till more sailors learn about it, and eventually there may be a public source.

(Later on we will figure out the georeferencing of the UW maps for the Southern Waters of Admiralty Inlet and Puget Sound and post them as well. To proceed on your own with that, just make your best guess of 3 points, then load it into Expedition, and then use that display to see how to fine tune the coordinates to line up with the base map geographic outlines. This is a bit harder than it should be because the UW maps do not use a Lat-Lon grid, but some other coordinate system.)


Friday, February 12, 2016

Quick Way to Know if you are in the Traffic Lanes

Sailing in Puget Sound or other areas with much ship traffic, a primary ongoing navigation concern is where we are relative to the VTS shipping lanes. It is a matter of safety, and a matter of the Navigation Rules. On smaller powerboats and when sailing, we have no rights in the lanes:

Rule 10 (j). A vessel of less than 20 meters in length or a sailing vessel shall not impede the safe passage of a power-driven vessel following a traffic lane.
In fact, it is worse than "no rights."  Normal obligations of the give way vessel start out with "When two power-driven vessels are crossing so as to involve risk of collision..." Other obligations are worded as "stay clear of..."  But "do not impede" is much stronger. This is partly explained in

Rule 8 (f) (i) A vessel which, by any of these Rules, is required not to impede the passage or safe passage of another vessel shall, when required by the circumstances of the case, take early action to allow sufficient sea room for the safe passage of the other vessel.
The Admiralty Court has clarified this even further to explain that it means not just preventing risk of collision but preventing the development of risk of collision.  (The sometimes heard interpretation of this rule to mean I can do whatever I want so long as the ship does not have to alter course, is in a sense doubly wrong as it is even more lax than staying clear.)

Thus if you choose to cross the path of a ship in the traffic lanes you have to consider not just whether you have plenty of time to get by, but you have to consider what could happen that might make this go wrong. I can't find the reference for the moment, but in recent news a collision did occur with a ship and a powerboat whose engine stalled right in front of path of the ship. Considering the speed of a ship and their inability to stop, this crossing did not avoid development of risk. The stalled engine is thus no defense at all.

I have one vivid recollection from racing in the very region to be discussed in the video below. The situation was such that the wind in the area of the lanes, toward the middle of the Sound, was much favored over winds more inshore. So there was a big advantage to be gained the farther we could sail out toward the middle. We were on a tack headed out to the lanes as a ship came down the inbound lane from some distance off. The skipper's tactic was to tack out till right in line with the ship's path and then tack back, which would provide plenty of increasing separation as we sailed away from the path of the approaching ship. It was considered a safe tactic as we did not cross the path of the ship.

Unfortunately, as happens sometimes, during the hurried tack, the sheet got a knot in it on the tack, and when you tack and do not throw off, you heave to!  Thus we were dead in the water in direct line of the ship. The sheet had to be cut, which was in retrospect a small price for making a maneuver that was indeed indefensible.  We did not avoid a circumstance within the shipping lanes that could develop into the risk of collision.

Knowing where you are relative to the lanes is crucial in these waters, as is knowing the Rules about interacting with the lanes.

With a full nav station running an echart program with the lanes marked, you could in principle see where are you are relative to the lanes at all times. But with such systems you have to zoom in and out to see what you want, and you can in fact over zoom with a slipped mouse click and lose the picture at just the wrong time. Also to be precise about it, you would have to call up a tool to actually measure the distance from the lanes etc.  Nevertheless, when you have full navigation underway and working well, this is usually not an issue to know where you are relative to the lanes.

But short handed you might not have continuous view of the echart, or in a small boat with no built in electronics you need another tool, which is the subject at hand, and electronics is the best solution.  And I would venture that if you race routinely in the area of the shipping lanes, it could well pay to set up your phone or a tablet to supplement your routine nav info with this trick that keeps you instantly aware of where you are relative to the lanes. It is an easy double check on important information.

There is no practical piloting methods that will tell us this to the level of accuracy needed in the time frame needed. We might, and often do, try to get away with just knowing there are lanes present, and then guessing where they are when we do see a ship approaching and then try to maneuver based on that.  But that can be dangerous, as we do not really know where the ship is within the lanes,  and this approach is at least very inefficient. You could be going out of your way to avoid the traffic and not need to.  (Though off topic a bit, I should add that if your echarting included a good AIS display from your own receiver—not some Internet relay, which is dangerous—that would tell you if the ships are in the right place.)

Thus we have this easy trick to solve the problem of knowing precisely where we are relative to the lanes. It can be done on a phone or tablet, so even the smallest vessel can use it.  This method is particularly valuable to those who sail or paddle in the same area, as you can set it up once and then just turn it on the next time without any set up.

The trick is to set up a fake route (waypoint 1 to waypoint 2) marking the center of the separation zone and then just monitor the XTE to that fake route as we sail in the vicinity of the lanes. Below is an outline of the process, followed by a video illustration.


Step 1. Set up a route on the echart along the center of the separation zone between the inbound and outbound lines. Lock and save the route.

Step 2. Measure the perpendicular distance from that route to the boundary of both the separation zone and the outer limit of the lane. In Puget Sound the lanes are about 0.5 nmi across with about 0.25 miles of separation zone between them. Thus the outer distance is 0.62 nmi and the inner distance is 0.12.

Step 3. Activate  the route as if you were sailing toward one of the end points. This is not the case, so distance and time to the waypoint, and so on will be nonsense (just don't display these), but the cross track error (XTE) will still be right. That display then tells you precisely were you are.  The COG and SOG, total time and distance sailed will be right, so these could be useful displays as well, but for this exercise it is the XTE we are focusing on.

XTE > 0.62 you are outside of the lanes

XTE < 06.2 you are inside the lane
XTE < 0.12 and you are in the separation zone.

The values and what they mean are the same on either side of the lanes, but the XTE display will change labels, such as R going to L, or >> going to <<, etc. The directions will depend on the order you have for the waypoints, but routes can always be reversed so that does not matter.


I will add here phone and tablet apps that work well for this as I find them. Here is one:
memory-map navigator, which has versions for iOS, Android, and Windows mobile. This is excellent inexpensive product, but I am sure there are others.