Wednesday, June 20, 2018

Dip Short, Distance Off, and Running Fix

We use dip short primarily for practicing with cel nav sights on land using a shoreline of a lake or bay that happens to be too close to use, so the shoreline is blocking out the true sea horizon.  We can determine if a shore is far enough away to ignore this issue using the square root of our height of eye (HE) above the water surface.  The minimum distance for a good sea horizon is D in nmi must be greater than the Sqrt (HE in feet).  Standing on a dock with HE = 16 ft, if the shoreline I use for a horizon is 4 nmi or more away, then I can use that shoreline as if an open ocean horizon.  Nothing special would be required for cel nav sight reductions.

Indeed, for D > Sqrt (HE) we are not actually seeing the shoreline; the curvature of the earth is blocking it and we are seeing a true horizon.

Beyond its use in sextant practice on land, dip short remains a practical tool for the navigator's bag of tricks. It was more important to large vessels that relied on cel nav than it is to smaller ones because with a low HE you have to be right up on the land to have the shoreline blocked, i.e., at 9 ft HE you can be within 3 nmi of the beach and still get good sights using the shoreline.  On a taller ship this would be more like 5 or 6 miles.

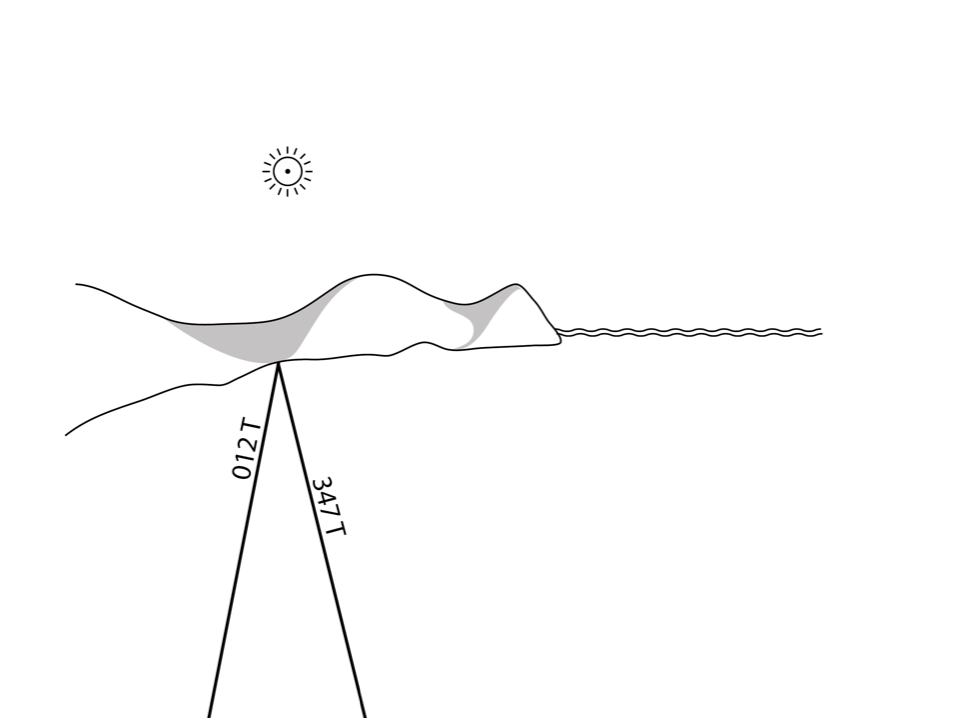
In any event, if we have not had any good navigation for quite a while and come up on land during the night that we cannot identify, changes are we would hang out till day break to carry on.  And if the sun came up over the land as in the pic below, we would want a sun sight to start figuring out where we are, but if the shore is too close, we have to solve for dip short.

But to do this, we need both HE and the distance to the shoreline (D) which we do not offhand know so far. We do not even know what land we are up against; no chart, no info.  And that is the subject at hand: how to find our distance off in this case so we can use dip short.

Below shows the sun over the land. We are some distance off, standing at HE = 9ft and we guess we are closer than 3 nmi.  


Step 1 is take a bearing to an identifiable land mark on the shoreline. Let's say it was 347 T. This is plotted below on the same picture, but just assume you are doing this on a black sheet of paper, on which you represent the landmark as just a dot on the paper.  We choose to have the top of the page be 000T and then use any protractor to lay off the 347 line of position (LOP).


 Now we head off on course 294 T and mark the time and our speed, or note the log, and watch for the bearing to change at least 30º or so. In this example when we found that the bearing the chosen landmark was 012 T after traveling 0.6 nmi. That second LOP is plotted below.


Now we  have enough info to figure our distance off as shown in the next picture.  We do a running fix, which is described first, then we go over a more automatic solution.  We now have to establish a miles scale for our blank piece of paper. It can be anything; just pick something convenient.


We know when we started to move we were on the 347 LOP. Then we sailed 0.6 nmi in direction 294  and ended up on the 012  LOP.  There is just one place where that can be true, and when we find that we have found our position, relative to the landmark, which gives us the distance off we want.

We cannot have been at point A, because 0.6 nmi toward 294 does not get us to the next bearing line. We also cannot have been at point B, because our run would have put us past our known LOP.  You can set the dividers to 0.6 nmi and use parallel rulers to find the right place, i.e., point C, but there is an easier approach.


The systematic solution that does not require hunting around is just pick any point A, and plot out the 0.6 nmi in direction of your course, 294, and make a dot.  Then use the parallel rulers to move the initial 347 LOP over to that point, as shown above with the dotted line.  Where that line crosses the 012 LOP is your running fix.  Now use your miles scale to figure the distance off the landmark, which is what we needed. We still have no idea where we are, but we do know we are 1.1 nmi off that landmark and that is what we need to find dip short.

 The regular dip correction shown in the Nautical Almanac is computed from the formula shown below for dip.  With our HE of 9 ft, this would be a correction of -2.9' to the sextant height. At any height above the water we are seeing over the true horizon, so our sextant heights are too big and we have to account for this with the dip correction.

When the land is too close, we do not see the proper horizon for our HE. The horizon is too close so our sextant height is even bigger than it would be for a true horizon, so we will have a bigger dip correction, the so called dip short. That is a given from the formula below, which is in our cel nav textbook and many other places.

When we put in our HE and measured D we see that the dip short we should use is 5.1', which is also a negative correction.  So doing this right in this particular example, we gained just over 3 nmi accuracy in our cel nav sun sights.  Below shows the horizon we used (solid line of the shore) compared to what we corrected to with dip short (dotted line).


Saturday, June 16, 2018

Davis Mark 3 Sextant Part 1 — How to read the Angle Scales

This is one of several notes with associated videos on the use of the Davis Mark 3 sextant. We have a more general book on How to Use Plastic Sextants, but now we are focusing in on the Mark 3.  The reason for this focus is a bigger challenge we set for ourselves in our new booklet that teaches mariners how to use a sextant and find position at sea with no previous training at all. In fact, to the extent we succeed, you do not need this article or video! Just get the book and open it when you need it. To that end, we put together a kit that includes one of these sextants, this new booklet, and a few other things to serve as a GPS Backup Kit.

But for now, however, we address those who, for whatever reason, wish to use a Mark 3 sextant. There is a manual that comes with the Mark 3, rather detailed even, but it is our experience from teaching cel nav for so many years to so many thousands of students that the stock manual is not enough. So our GPS Backup Kit includes the book below, which explains how to use the Mark 3, which must start with how to read the scales, the subject at hand.


Back and front covers of our new book, available in print or ebook format.

Later we address how to calibrate the sextant and take sun and star sights, but now we just look at how to read the scales.  Below is the angle the sextant measures, called sextant height (Hs).


Below is a picture of the Mark 3 with parts identified. There are two adjustment screws (#1 and #2) which we discuss later. The angle we measure Hs will be in the form 39º 20', which is about what the one below is set to. 


We read the degrees part of the angle from the arc scale, and the minutes part of the angle from the vernier scale at the bottom of the index arm that slides along the arc. A vernier scale is a way to estimate fractional positions between two lines. The linear version we use today was invented by Pierre Vernier in the 1630s, likely based on a circular version used by Portuguese navigators in the late 1500s. The vernier scale has interval separations slightly larger than those on the scale it is interpolating. In the picture below we see that 30 intervals on the vernier scale span 31 intervals on the arc scale.

Start by looking at sample A below (click the pic for a better view). This is a reference showing what 0º 0' looks like. The checks we make for sextant calibration at each sight (index error) will be just a slight variation of this alignment, as discussed below.

Click the image for a bigger view.
The degrees part of any sight is read from the arc scale relative to the 0' mark on the vernier scale. In sample B we see from the degrees scale that the angle is bigger than 32º, but somewhat less than halfway to 33º. In other words the minutes part of the angle will be less than 30' It is always valuable to estimate what the minutes are before actually checking to see what they are. In this case, for example, you might decide is this just a bit bigger than 32 or is it almost 33 or is it near halfway, just below or above halfway, and so on.

Use the vernier scale to to get a better measure by finding which of the tic marks on the vernier scale most closely lines up with any of the degree marks above it. Zooming in on the image (which we do with a small magnifying glass when underway) we see that 20' or 22' could be considered aligned, with 18' or 24' definitely not aligned. Note too that the out of alignment marks will be off in the opposite direction on either side of the best aligned one... or maybe two, as in this case.  We called this one 22, but you could argue in this case that 21' might be best, since 20 and 22 were pretty close.

In Sample C this is a little easier with the degrees being almost 32, but not quite, so degrees part is 31º and the minutes alignment is best at 46'. Again, notice that the 45' and 57' are off in opposite directions.

A possible blunder to make in these measurements is to count the degrees scale backwards. In sample C that would be reading the angle as just bigger than 28º. It pays to double check we are doing that right. In other configurations it could be more misleading.


Another challenge we face is when it looks like the degrees line up exactly as in sample D. It would be a mistake to call this 28º 00' and go on.  When the degrees line up very closely (as they will with all of the index error measurements) then we must turn to the vernier scale to see if it is large minutes or small minutes that line up. Small minutes alignment means you are just over 32º; large minutes alignment means you are just under 32º and the actual degrees part is 31º, not 32º. Zooming in on D we see that 4' is the best alignment, so the angle is 32º 4'.

The next three samples are what we see when measuring the index correction, discussed later. In sample E we can see from the degrees scale alone that we are just above 0º and checking the vernier we see the amount above is 6', with 4' and 8' off in opposite directions. This value of Hs would be 0º 6'. When doing an index correction measurement we would call this 6' "On the scale."

In sample F we have similar case, but in this one it is easier to see that both 4' and 6' are equally unaligned but they are better than all the others, so this would be called 5' On the scale.

In sample G we cannot tell from the 0º alignment if this is above or below 0, so we check the vernier to find that the 52' mark is best aligned, and again we check that the alignment on either side is off in the opposite directions.  With these large minutes aligned, we have effectively -1º + 52' = -8'.  In other words, this alignment is just 8' Off the scale, which is how we would record it.

For index corrections we have then either small minutes aligned which are called "On the scale" or we have large minutes aligned and we subtract that from 60' and call the result "Off the scale."

That is how the scales are read. This must be done carefully if we want to get out the full potential of the Mark 3 sextant. A small magnifier helps.  Also we stress multiple places that whenever possible we should not rely on just one measurement. For good work we should take 3 or 4 sights each time so we can average the results.

We will add more articles and videos on the use of this sextant, but they will now assume we know how to read it.


Friday, June 15, 2018

Race to Alaska (R2AK) Navigation

A question came up in our online nav course about R2AK navigation. As it turns out we have worked on this route in great detail a couple years ago as we assisted the Team MAD Dog in preparation for their record setting race. I started to answer this longish question in our class discussion forum, but decided it could be of broader interest, so I put these notes here.

All such planning starts with the waypoints. We made this set for the full race that the team then transferred into their two handheld GPS units and also into Navionics "Boat US and Canada" app on two iPhones and one Android phone. This app for about $50 includes all Canadian charts. They are not as good as the official Canadian echarts, but those cost $200 or $300 from EC... although there is a very good set from RosePoint Navigation for $99 the last I Checked, but these may only work on Coastal Explorer.

PS. There are some tricks to getting an external gpx file into a mobile app version of Navionics. On the other hand, it is relatively easy to get them into a Garmin handheld.

R2AK-1.gpx is the full route Port Townsend to Ketchikan, with logical waypoints numbered and named from start to finish.  R2AK-2.gpx and R2AK-3.gpx are two short alternative legs if the main route has bad weather in these regions. [ Might have to right click and choose save, else you might look directly at the xml files.]

These files can be loaded into OpenCPN or other enav program and then studied in on the screen and on the routes manager display. Without Canadian charts, however, the details are hard to discern. The WA and AK charts are free downloads.

You can also drag these gpx files onto Google Earth to see what the routes look like in detail. There is some thought that there could be very many routes to Ketchikan, and probably so, but there is a logical direct route if weather permits.

Next we used current predictions from the Canadian Current Atlas that we customized and made into ebooks that could be loaded into their phones. Then each day and hour is a book mark, easy to find. Recall that MADDOG was all navigated from the trampoline of an open catamaran. No nav station and no other electronics.


Once into AK waters, we used our own publication called Southeast Alaska Current Atlas, and did the same ebook layout with that data. Both of these convenient current presentations paid off.


This was an unassisted race, so they had to get their weather info underway themselves, but we could run a day or so out at least as starting points. We considered the key was getting to Seymour Narrows on time, so this was focused upon.  They hit the Narrows, exactly as the current turned in their favor, flying by at 20 kts as the fishing boats hanging out for the right time were pulling their anchors.

Now we have better wind data than we had at that time.  For US waters WA and AK you can use the HRRR (our 19 hr, updated hourly) or 3-km NAM for longer runs.  The best data once into Canada would be HRDPS - High Resolution Deterministic Prediction System, which is 1.3 km run every 6h out to 2 days.  You can get that from LuckGrib on an iPad and transfer it to Expedition for routing... or just look at it on the luckgrib app. OpenCPN and other popular nav programs may not be able to read it.

Our new book Modern Marine Weather 3rd edition includes detailed discussions of latest high resolution models.


Another key factor to the navigation of this route is floating logs and sometimes deadheads—meaning logs floating vertical with not much showing.  The latter is a risk throughout the Pacific Northwest, but the probability of colliding with one is small.   The when seen they should be reported to the Coast Guard who will then tag them with a flag.

On the other hand, after a very high tide, many of the logs that were beached find there way back into the water,  and these can be a serious impediment in some channels.  I have seen cases there where we had to navigate through a maze of these at dead slow.  This means navigation at night in these conditions takes special care.

As always, a careful reading the the US and Canadian Coast Pilots (the latter called Sailing Directions) is mandatory for this route.  The US versions are free downloads, the Canadian Sailing Directions for BC come in four volumes.  There are also numerous cruising guides to these waters with discussions of anchorages and small boat facilities.

If questions come up on this navigation, then post a question here or in the classroom.

We have other more general weather notes on the inside passage at

www.starpath.com/insidepassage  Be sure to get a copy of the BC Mariner's Weather Guide which is a top left link on that page. This shows where all the reporting stations are located.

See also this link that gives a gpx file of the current station locations.


Sunday, June 10, 2018

Weems & Plath Expanding Square SAR Course Identifier #113

A common search pattern used in search and rescue (SAR) operations is called the expanding square pattern, which is just what it says it is. You travel along calculated route legs in a pattern that expands every 3rd leg so you systematically cover the the search area in an expanding pattern, as shown below.


To plan out such a pattern you need to know your (1) initial heading, (2) the distance you want between the squares, (3) your boat speed, and (4) the time you plan to start. 

In one sense, the next logical step is turn to your electronic charting program, put in the way points, select an average speed and start time, and look at the resulting route plan, which will tell you the headings and times to turn onto each leg.  Then print that plan or take a picture of it with your cellphone.  In fact, the route itself will be laid out on the chart plotter and you can just follow it.

Or you could simply start off with the boat's track showing, and create the route from your displayed and saved vessel track... But that is not the point at hand.  Several agencies, including the USCG who certify assist vessels require that you solve this manually, without relying on any electronics, and we can't truly fault them for that. We want this done right, and we don't want it fouled up if the electronics hick up, or we accidentally push the wrong button on some display.

A device for doing this is offered by Weems-Plath.com called the #113 Course and Leg Identifier, and this note explains how to use that.  The instructions that come with the device are sparse and strangely enough several other descriptions of the device I have seen do not add to it.  So we were happy to add a few notes on this when asked.

Below is a picture of the device. The middle disk rotates so you can point it in the initial heading of the search pattern, in this example 030.  This device implies this will be on a heading that is a multiple of 15º, but it does not matter if you use true or magnetic headings for this.


For higher res image, click above, then right click and choose open in new tab,
then click that for a big picture of the device. 
Or download pdf of this note.

Procedure

Step 1. Point the track to your initial heading in multiples of 15.

Step 2. Choose your track spacing and boat speed, and enter the table (bottom left) of times for various leg separations and boat speeds. In the example used here, we choose legs 1 mile apart with a vessel speed of 10 kts.  This gives us a time increment of 6 min.  Had we chosen a separation of 1.5 miles with a boat speed of 12 kts, the tine interval would be 7m 30s.

[This is just the boat speed in minutes per mile (60/S) multiplied by the distance run.]

This  6 min the main time interval used to figure the times for each turn.  Each leg has a multiplier on it. For leg 5 this is x3. See green circles in the figure.

Step 3. Mark the start time at the base of leg 1, and then compute the turn times for each leg and write them with pencil in the spaces provided as shown.  Pencil marks on this disk can be erased for later use.

This step takes some care as mistakes are easy, so double check your work.  Then you head off on the headings indicated and turn at the times you have marked.

Obviously, if you do have a chart plotter, watch it to be sure you are making a square search pattern.  Current or leeway could through this off—but that is a feature, not a bug, as discussed at the end of this note. 

Below is this example, roughly laid out in OpenCPN (ie legs and headings not precisely set; just click, click, click...) and the corresponding route plan, which can be used to check if we were right with the Course and Leg Identifier.


After publishing this note, we received a valuable comment from an experienced user. This is reproduced below (with annotation), and it is now in the pdf copy of this article.

Just wanted make a correction to the use of the expanding square (SS) and the sector (VS) search patterns. Both these patterns are intended to be drifting patterns as such they are never plotted on a chart or ECS. They are driven purely by stopwatch and compass. The distortion of the pattern by the on scene drift is actually desirable as your search object is also drifting. 

(The track of past positions will automatically be drawn on any echart program and these are valuable to monitor. The commenter's point is we are  better off doing this by DR alone and not by course and speed over ground if there is any set or leeway.)

Another idiosyncrasy of this tool worth mentioning is the proper track spacing for a man in the water is not on the table, namely  0.1 nm or 200 yards. Which is achieved by 1 minute legs at 6 knots, which is the clutch ahead speed for a lot of power driven vessels. 

When you arrive at the last known position of a vessel and she’s not there, you have to assume you are looking for people in the water. 

Take a minute to determine the set (and leeway by noting COG and SOG from the GPS when DIW.)
Use that as your first leg course, then set off at clutch ahead and one minute legs.

Usually the sector pattern is done first, start and end positions compared to get a more accurate set then a expanding square using that data.

The length of each leg is largely determined by sea conditions and your range of clear visibility.... and we do indeed want to have the current and leeway in mind. A person in the water will drift with the current, but will not be affected by leeway as much as the searching vessel will be.

Software solutions

The extensive package of free navigation apps by Andres Ruiz González called Navigation Algorithms has a dedicated section on search and rescue patterns. Samples are shown below.

These patterns are computed and then exported as GPX files for the navigation GPS unit, as noted above. However, in strong current, the DR method directly should be considered because the target will be drifting with the current.


Thursday, June 7, 2018

Free Barometer App Designed for Mariners


Not many mariners realize that the most accurate barometer on the boat might be in their pocket... in their cellphones. There are not any native functions in iOS or Android phones that show the pressure reading, so you would not know it is there by just surfing around the functions of your phone.  It is not listed anywhere.  A third party app is needed to test that you have one.  There are many free versions of such apps, which brings up point one. Why do we make another one when there are so many already?

We want to let folks know about this tremendous resource, but then we are asked for an app recommendation, and the problem begins. Until now, the apps have all been too complicated. They want to do more, so they end up doing things like getting your elevation from the GPS, which even with a WAAS satellite connected is not accurate enough for barometer work adaptable to marine navigation.  In these days of remarkable weather services via model forecasts, we want the pressure accurate enough that we can tell if a surface analysis map is correct or not, so we can believe the forecast. In the tropics, we can also use accurate values of the pressure as a very powerful means of tropical storm forecasting.

Even worse than that, some apps get what is often called a "reference pressure" from the nearest airport, which are readily available online. Again, these maneuvers end up with pressures that are not accurate enough for our needs. There are even a few Andorid apps I have seen that do this without even saying what they are doing  In short, we could not find any app that we could recommend to our students to take advantage of this powerful, free resource.

Also only a few of the apps include a way to offset the sensor pressure, which, as good as the phone barometers are, they do, almost all, need some small adjustment (up to ± 2 mb or so) to be set right. So having an easy, transparent way to do that precisely is crucial.

Then the other common drawback is most apps do not have a way to store the data at all, let alone storing it with the time and location that we need.

So we have addressed these issues in the Starpath Marine Barometer App for iOS and Android.

Below are the four screens available to the user.


There is a rather detailed help file included with it to explain the features. You can set a sensor offset and we explain how to do that, and for sea level pressure you must manually enter the station elevation, ie how high is the phone above sea level when using it. In tidal waters we explain how to find the right elevation in the presence of tides.

You can store a pressure permanently, along with the time and your location.  Note that any app that uses the barometer has to be given access to Location Services in an iPhone, even if they are not using the location for anything.  Since there is no separate way in the phone to give access to the barometer sensor, this is the way Apple chooses to cover that permission.

We use the GPS sensor only for Lat, Lon, nothing else.  Also when you store the pressure it also records your sensor offset so you have a record of when that was done and under what conditions.

The only sort of bonus addition is we do add an option for averaging the pressure over the past 14 seconds. This covers the change in barometer elevation in a seaway. I will post a video soon that shows these functions in action—it's a mini workout; you do it on the stairs. This averaging can be shut off for use on land.

We do include the clear caution that the convenience of this accurate digital pressure from your phone—or any other electronic barometer—is not intended to replace a trusted aneroid barometer. All electronics are vulnerable to the rigors of the ocean environment. We compare a good mechanical instrument like the Fischer precision aneroid barometer to a sextant. It is a maritime investment that will remain dependable for generations.

We also note that the pressure data stored in the phone is intended to be transcribed to the ships printed logbook at your early convenience.

For more information and links to the app stores see Starpath Marine Barometer.

____

We have learned the Apple SE phones do not have a barometer. The barometer sensor seems to start with the ver 6 iPhones and newer. Also please note that not all tablets (Apple or Android) have a barometer, even newish ones. If you load the device and everything works except it shows no pressure then chances are your device has no barometer. This can usually be checked by a good inquiry about barometers in your model of phone.