AIS is a key component of any electronic charting system (ECS). In our course on Electronic Chart Navigation, we use qtVlm for our ECS. It has a sophisticated AIS presentation, plus a unique tool for accessing live AIS traffic internationally and interacting with them from your own real or simulated vessel. Here we want to outline the use of AIS in qtVlm. As with other features of this diverse program, there are options to be sorted out.
For background on the Automatic Identification System, known universally by the initialism AIS, please see Introduction to AIS.
How to get AIS targets onto the qtVlm screen
These notes are just how to turn it on; once on, what you see depends on several other settings, which we come back to.
(1) Simulation mode. To interact with the AIS traffic, and not just look at it, run a simulation. First, turn on AIS from the icon in the toolbar if not already on (bright green is on; gray is off), then move your boat to anywhere in the world you choose to be during the simulation, and then start a simulation.
Figure 1. Toolbar icons. There are a lot of these, along with the option in Settings to choose which ones you want to see in your toolbar.
You will then see AIS traffic within 50 nmi of your boat location. These targets are internet AIS, which we discuss below. This AIS traffic will show up essentially regardless of other AIS settings, as long as the AIS icon is turned on. Note the AIS must be turned on before starting the simulation; if turned on after starting, it will end that simulation, which you can start again, now connected to the AIS data server.
(2) View internet AIS. To see AIS traffic without simulation, move the boat to the chosen position, then in menu Configuration/AIS/Options turn on AIS via Internet. Then press OK to close that window, and at the base of the microboard, Start NMEA and the traffic will appear. Again, within 50 mi of your location and the AIS on icon must be turned on.
Figure 2. AIS display options. Bottom circled button turns internet AIS without simulation; this is not needed in simulation mode. The top two indicated can be left off—they could hide AIS targets with or without simulation.
(3) Live AIS. We can also see live AIS targets on the screen from our own AIS receiver when sailing underway that we load into qtVlm. These would come into the system as NMEA sentences, so we would need to tell qtVlm the source of the input, which is done in menu Config/NMEA connections/Incoming.
When displaying your own live AIS reception, you can also turn on the AIS via internet shown above. With this on, you see both live AIS and internet AIS, where the latter are marked with a red dot. If there is a report from the same vessel from both your live AIS and the internet AIS then only the live AIS will show. The internet AIS targets can be delayed by a minute or more, compared to the much faster updates for live AIS, up to every 2 seconds (see Into article cited). Thus adding the internet AIS would be of most value for the more distant targets that your antenna might not be picking up.
The AIS showing in the simulation mode do not show the red dots because we know they are all internet AIS.
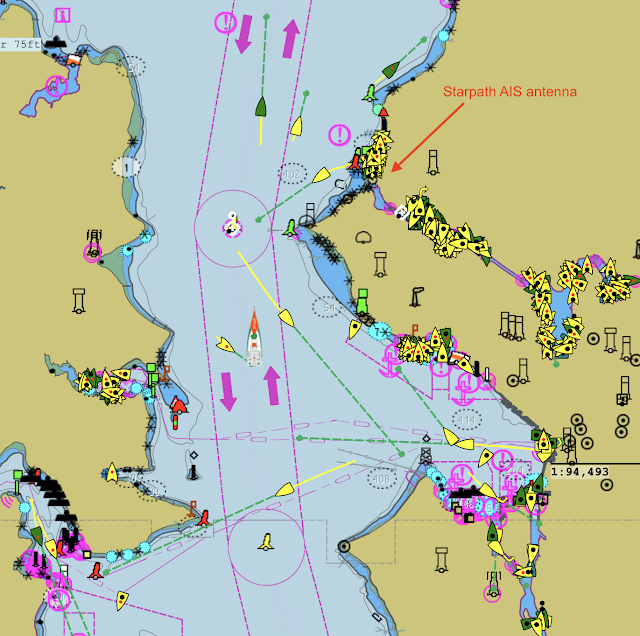
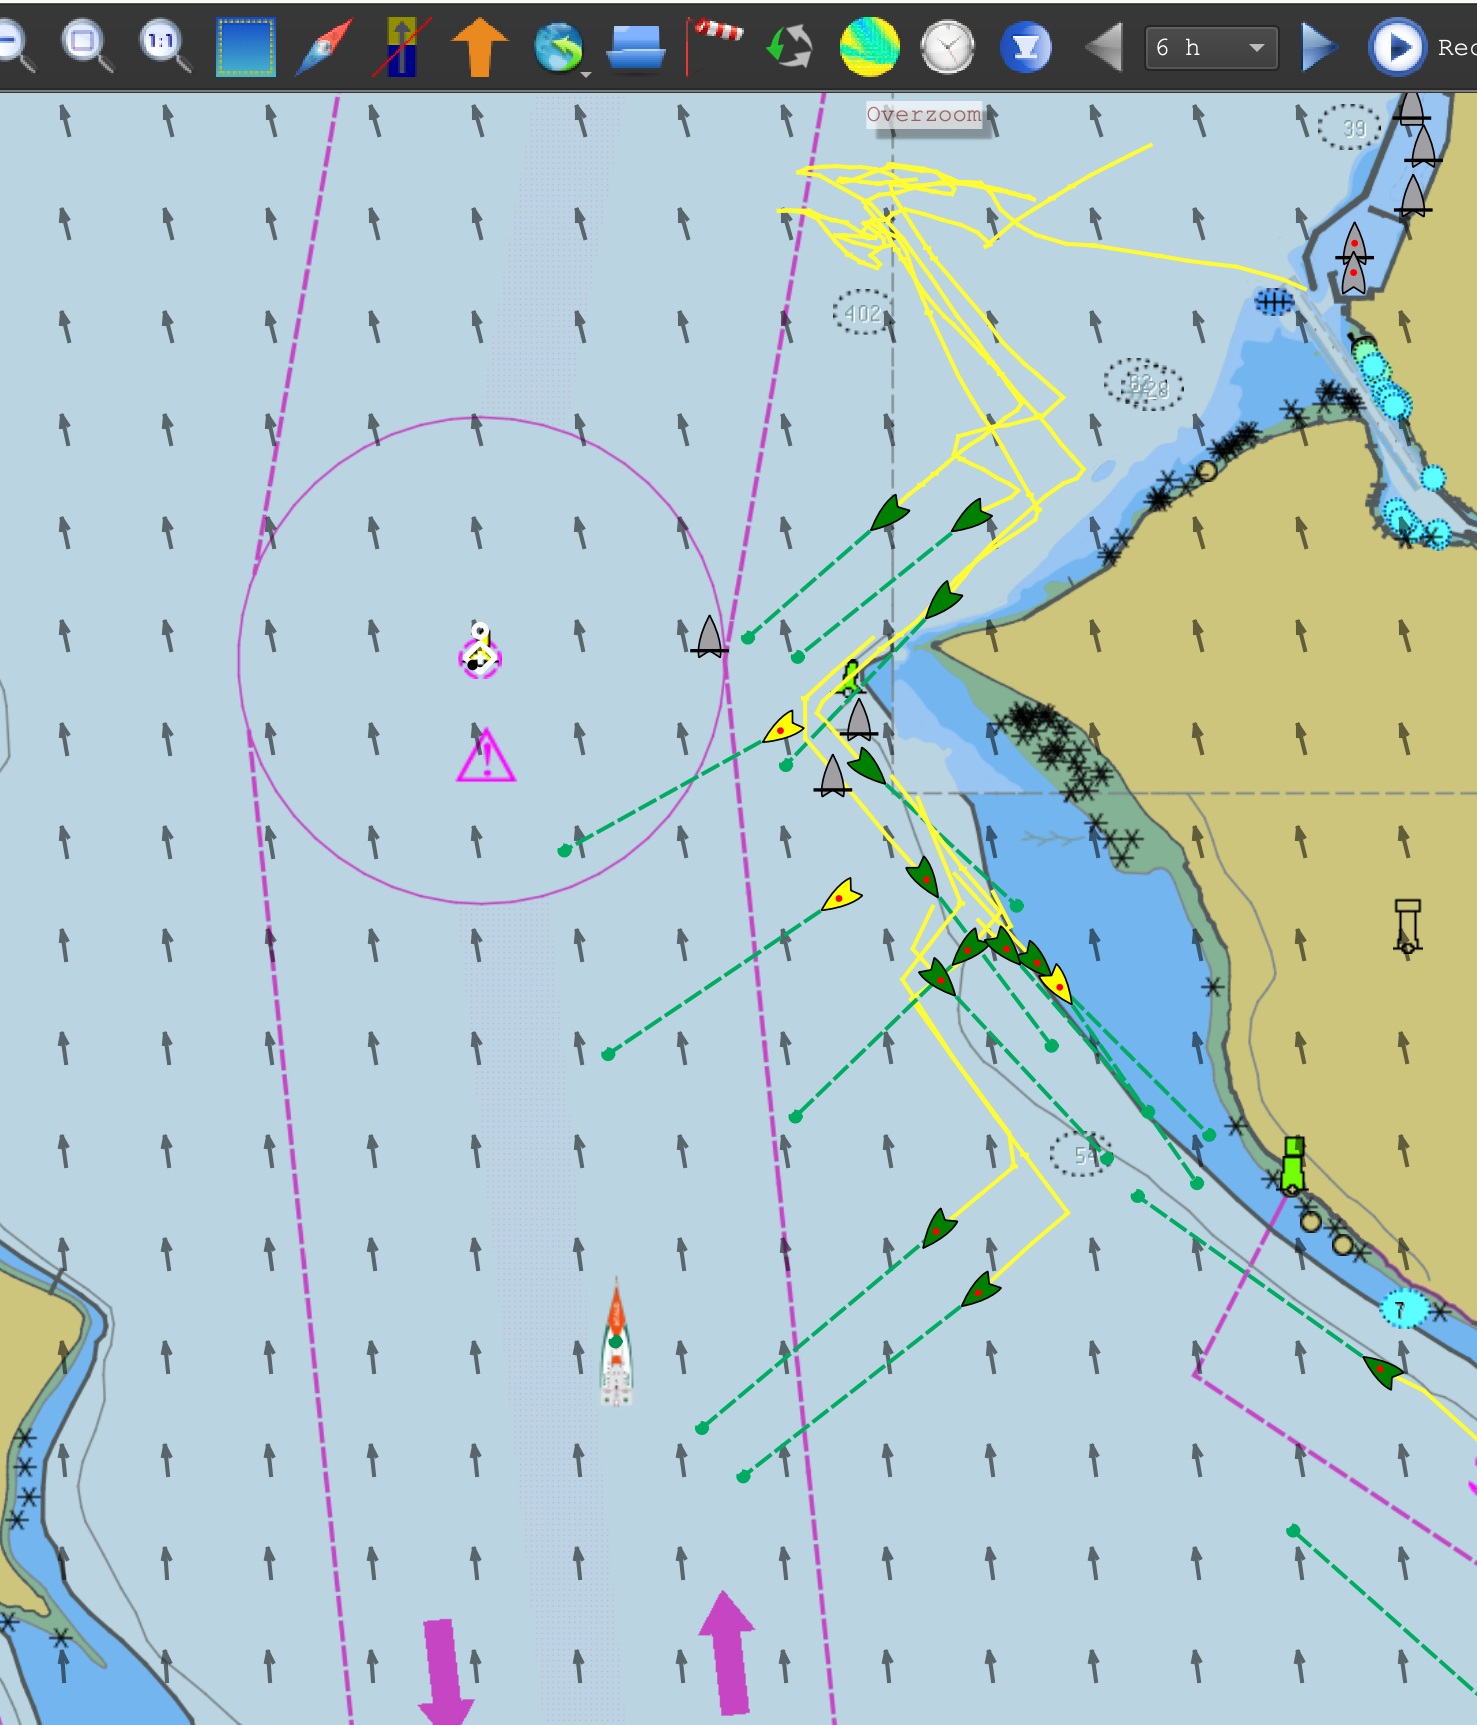
Figure 3. Live and internet AIS. The yellow and green boats are all vessels sending out AIS signals that are picked up not just by other vessels, but also by numerous land based AIS antennas, such as the one we have at Starpath HQ. These signals are then sent to one of several companies that compile them and then redistribute to users around the world via the internet. Marine Traffic and Vessel Finder are two popular examples. In qtVlm, internet targets have a red dot. Targets with black dots (symbolizing an anchor ball daymark) are those with an SOG below a user selected value. We cannot stress often enough that internet AIS are delayed signals, so they must be used with much caution. A target seen approaching you as an internet AIS vessel, could be well past you at this moment. A real, live AIS receiver is inexpensive and should be considered part of your minimum navigation equipment.
Figure 4. Live AIS from the Starpath receiver (no red dot) and from internet AIS (red dots). Here I turned on the option hide targets with speeds under 0.5 kts. I also shut off the landmark objects from the ENC display. The range ring on our HQ location is 10 nmi radius. It looks like our antenna receives signals from out to almost 10 nmi.
(4) Replay saved file. Another way to see AIS traffic is to replay a saved file of a NMEA stream of real data that you saved from a previous voyage, or someone else did, and then sent you the file to view.
Types of targets seen on the screen
(1) Yellow vs. green. This distinction marks how much data we have on the target. Yellow means we have just the dynamic data of position, COG, SOG, and heading if they have a heading sensor. This data is given every 2 to 30 sec, depending on the target. Green means we have the full set of static and voyage data. This data can take up to 6 minutes to update.
(2) Flat stern vs. v-shaped stern. Class A targets have a flat stern whereas class B targets have a v-shaped stern. This is a convenient distinction to note as it often distinguishes commercial from recreational vessels, which in turn signals the update time to be expected. This latter fact is often wiped out when viewing internet AIS as their updates are typically delayed a minute or more.
(3) Blue vs. pink targets. Your own AIS symbol will be white, showing on top of your vessel icon. If there is another user online who has placed their boat near yours and turned on the simulation mode, then you will see their boat on your screen as a blue AIS target. Indeed, you could run a simulated yacht race this way with multiple participants from around the world.
If another user in some part of the world is navigating live with qtVlm and they decide to turn on Share position in the options screen shown above, then they will show up as a pink AIS target on your screen. You would, of course, have to set your screen to where they are in order to see them. In other words, a blue or pink AIS target is a qtVlm user, with the blue one being a simulated vessel and the pink one being a real vessel.
(4) Gray targets. In the fifth line down on the options page shown in Figure 2 we can set the lost target time. If no signal has been received for this period of time a line is drawn across the target and a short time after that if still no signal, the target is turned to gray. Later on here we see how to tell the times of the updates.
(5) Red and olive green targets. Red targets are ones that pose a risk of collision according to the standards you have established in the AIS setup options, which we discuss below. An olive green target is one that you have assigned to your list of Friends, another topic we discuss below.
Figure 5. AIS targets in qtVlm by color. Note the 3 shades of green. The Inland version is only seen in Europe. There are several types of ATON targets. The "weather data" target has been active in qtVlm for some time, but just added here Oct 12, 2024. A unique powerful tool of qtVlm.
(6) Marks on the targets. As noted above, a red dot means it is an internet AIS target, but this is not shown in simulation mode.
A black dot on an AIS target means the reported SOG of the target is less than the user-set minimum speed indicated in the 7th line down of the options page above. A logical application would set this to zero or a few tenths of a knot, but it will mark the targets according to whatever speed is entered. If this option to hide them is turned on, it will then hide all targets below that speed.
A target with an engaged in fishing daymark (two cones, point to point) means this class A vessel has declared its navigation status to be vessel engaged in fishing. Below is a summary of these daymark icons. Remember that the navigation status that triggers these must be manually set by the vessel operator and it is not uncommon to see cases where they have not been updated properly.
Figure 6. Samples of AIS target icons. This is a qtVlm enhancement, not part of the AIS standards. Inland AIS targets are only seen in European inland waters. These navigation statuses are defined in the Navigation Rules (COLREGS).
Viewing individual target data
We have several ways to view target data both individually or in a table listing all targets (next section). Individual reports come in the form of a tooltip, abbreviated tracking data, or full details of a vessel, keeping in mind that we do not get all info until the target turns green.
Figure 7. Tooltip AIS info. A cursor over the target displays the tooltip info. If this were green it would include the vessel name. Also shown is the distance from our boat and the bearing to the target from our boat.
For other ways to look at the target info, right click the target to get the menu shown below:
Figure 8. Right click a target to get a menu of options.
For now we look at the top two options, Show tracking data, which pins a panel to the target that dynamically updates target data, and Details, which marks the target with a dashed square and shows still more info on that target in a movable window. The tracking data display is turned on and off from this right click popup window.
Figure 9. AIS tracking panel turned on for two vessels, both Washington State Ferries, following the ferry lanes marked on the ENC. This is a dynamic display that updates automatically and is pinned to the target. This can be turned on for any number of targets. The range and bearing from our vessel is also shown. The value in parenthesis shows how much the range to the target has changed since the last AIS update. A positive value means the target has gotten farther from you; a negative value means it is getting closer to you.
Examples of Detailed reports are shown below.
Figure 10. Detailed report windows. You can open more than one of these windows at a time and they will update, also showing time of last update, but you need to click a Details window to move the dashed box to that target to identify it — or turn on the Names as shown in Figure 11 below.
Figure 11. AIS target names turned on in the options window shown earlier in Figure 2. This is a good option to use as you might need to know a vessel name for a radio call.
The vessel's unique MMSI is also given, which can be used to identify the vessel and its ownership.
Several of these vessels shown above are part of a yacht race that started during the time I write this.
Figure 12. Watching a yacht race via AIS targets. We can see the starting area at the top where they milled about before the start, and then see them tacking south. The arrows are an HRRR model forecast of the wind.
This is an aside, but knowing when and where a race is going on, you can move your boat to that area, turn on simulation, stop your boat, and watch the race... or, indeed, load the latest wind forecast and use your polar to become a virtual participant in the race from your living room! A challenge in this exercise is inland wind forecasts can be off some—or a lot. I will make another note elsewhere on how you get around that as well as practice optimum routing at the same time. The HRRR model is updated every hour and extends out 18 hr.
AIS is a huge advantage when racing as you can monitor the speed and heading of your competitors. To do this best, however, we need to watch the targets in a program like qtVlm where we can mark competitors as Friends and get a better and more complete overview with tracks than we can do with typical console displays, plus zooming in for detailed looks. Below is another example.
Figure 13. Yacht race in France viewed as AIS targets in qtVlm. Any one of these boats sees all the others and can zoom in for details. Note the trick these sailors have done by identifying themselves as single-handers by adding "solo sailor" to the AIS vessel name. Normal AIS parameters do not include number on board, but Inland AIS does offer that as an optional output. Remember in qtVlm you can right click the chart and load all the weather buoys for up to the minute wind reports.
Viewing all targets in a table.
It can be valuable view a full list of all AIS targets in a convenient table that can be sorted as you choose. This is accomplished in qtVlm with menu View/AIS targets list, which brings up the following table.
Figure 13. AIS target list, here sorted by distance from boat. Recall you can click an image, then right click, open in new tab, and then zoom.
The table can be sorted under any of the headings, plus a click on the Center button on the left centers the view (under the table) on that target. This table window, however, like the Details window, can be moved off of the qtVlm screen to the side. To find a specific target, turn on target names, then zoom in to small area (say 5 nmi or so) wherever you are, and then click the left button to center on it.
It can be interesting to compare the vessel's heading (CTW) with its COG. If these differ, then it is possibly being set by current, especially if several in the area are offset about the same amount. When looking at this, recall that not all vessels have a heading sensor input to the AIS output (it is not a requirement) and periodically we see some that are simply not calibrated. Also for moored vessels or those with very small SOG indicating likely moored or anchored, the CTW can be stable with the COG bouncing around.
You can also find with this table which vessels around the world happen to be using qtVlm for live navigation and have shared their position. These special targets are not limited to the 50 nmi from your boat. You will often see several of these in French waters. They appear as pink targets. If you go to simulator mode and move your boat to their region, they will see you as a blue target, and indeed you can communicate with them using the qtVlm simulated VHF.
Class A target details have an extra line labeled Inland blue flag, followed by a box that can be gray, meaning no flag, or blue meaning blue flag set. This information applies only to European vessels using Inland AIS on inland waters. It is not a flag, but notification that the vessel carries a blue square daymark (called blue sign) indicating the intention to pass starboard to starboard. This is not used in the US, which would more likely be heard over the radio with the phrase "request to pass on two bells." AIS units with Inland capabilities have a way for the user to turn this on manually, but it is not used often. With qtVlm you can look at thousands of AIS targets on European inland waters and rarely ever see this turned on. When it is turned on, the vessel icon is half blue and half green along the centerline.
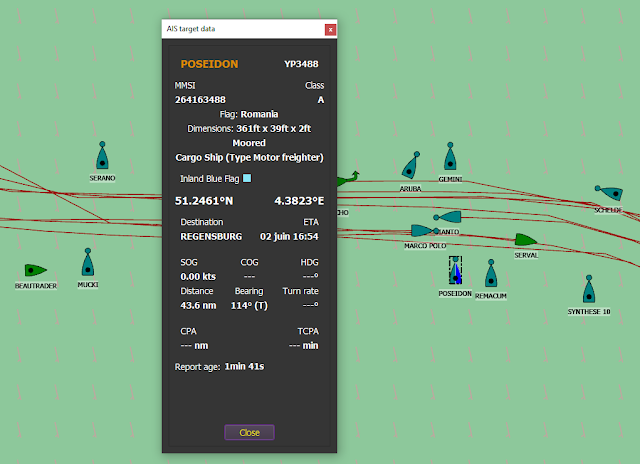
Figure 14. Rare example of Inland Blue Flag turned on, but note the vessel is moored, so this is an illegal use of the sign, like declaring underway using engine when moored—a finable offense for class A vessels as it uses up more bandwidth than needed (reports every 10s underway versus every 3 min when moored).
Collision avoidance and CPA data
With that long background on how qtVlm presents the targets, we can now get to the primary role of AIS, namely collision avoidance. It does this by alerting the navigator to the closest point of approach (CPA) of all AIS target vessels including the time to the CPA (TCPA). An advantage AIS has over radar in some circumstances is that it can see around corners. Traffic coming out from behind a cliff are not deleted by radar until in direct line of sight, but they are nicely seen on AIS while still behind the corner. Plus AIS gives us much quicker access to target COG and SOG and vessel name, which is useful.
(But radar remains rather more reassuring to some in that we are in a sense really seeing the targets, and though it takes a bit longer to derive, the COG and SOG we determine is measured rather than just read from a screen, whereas AIS requires rather more faith in the electronics. I am not counting ARPA radar functions here, because they in turn are also rather buried in electronic faith and careful calibrations.)
What you do with the CPA information is spelled out in the Navigation Rules, so this is a good place to remind readers about our super convenient set of the Navigation Rules online that we call the Starpath Pocket Navigation Rules Handbook. It is unique in that it has every single document related to the Rules, both US Inland and International COLREGS, on a single, long webpage, so when you search for a topic as explained in the introduction, you search all of these documents at once. It is also structured in such a way as to highlight the distinctions between US Inland and International Rules. For those who care to learn more about what we also call "The most important book in navigation," we have an engaging, thorough Navigation Rules Course.
Before looking at the limits on when CPA data are shown, Figure 15 shows a typical CPA display.
Figure 15. Sample CPA info for a single target. Our boat (A) is moving at 4.0 kts in direction 037 T. Reckoning (COG predictor) set to 6 min for our vessel and all AIS targets. B is where we will be in 6 min. The line AB is 0.4 nmi long. The red target (D) traveling at 7.8 kts (read from tracking data) is one that meets the CPA warning criteria we have selected, as discussed below. Beside the detected AIS target icon turning red, there is a red halo that expands and contracts around it to highlight the location when zoomed out, here shown in about its maximum radial extent. C and F are the computed locations of our vessel and the target vessel at the time of CPA, which is expected to happen in 16 min. The CPA itself at that time is the line CF, which is 427m, read from the tracking data. At CPA, the target will be bearing about 050R. This vessel will be passing ahead of us. At present, the vessel is aft of our beam, and 16 min later it is forward of the beam. In cases where this might not be so apparent, we can judge this from relative bearing A to D compared to B to E or C to F. Moving forward the target passes forward of us; moving aft we pass in front of it.
You can track and display the CPA data for all vessels within 50 nmi of your location! or choose to show it for just a single vessel of your choice, or with all vessels within some specified limits, which is the more typical choice. But even if we choose just one target to watch, we still have settings to select that affect what we see. All are in menu Configuration/AIS. The Options tab discussed above in Figure 2 has a couple related settings, which we go over below.
Figure 16. AIS display options, here focusing on ones that affect the CPA displays. See also Figure 2.
Going down the nine items in the Options tab, keeping in mind that these apply to all AIS targets, internet and/or live data:
1. Ignore if... With internet AIS we do not see beyond 50 nmi and with real AIS we are at about a 10-nmi range, so this setting does not matter much in many cases—at sea you would like to see the full 50, but at sea the AIS is satellite based and not much of that data gets into the internet AIS systems; it is expensive data not shared much with the free AIS distributors. The main concern here is not to let this get set to a low range by mistake!
2. Names... usually good to turn on unless there is so much traffic that the extra labels confuse the screen... but we can limit that other ways as we shall see.
3. Show only Friends... a way to tag selected vessels with a right click (Figure 8). In a race you can then sort the List of AIS targets by Friends (competitors) for a quick overview of performances. Unfriend in the same way. "Friends" seems a strange name for this function, but "Friend ship" is indeed an official AIS term used in this way; it was not made up by qtVlm.
4. Track... Just that. Turns on a track for each vessel. We typically want to see the tracks as an important record of what the vessel has done. Turning this off does not delete them, but turning AIS off will delete them. Unlike our own track, these cannot be saved nor interrogated.
5. Target lost after... not a crucial setting, but viewing internet AIS this has to be several minutes as the signal can get that much delayed at times. On the other hand, a lost signal that goes gray will return as yellow if the signals come back.
6. Reckoning... very important setting, as it shows where the target is headed. Usually best to make this reckoning time the same as used on your own boat. Six minutes or multiples of that are popular because at 6 minutes the length of the predictor line is one tenth of its SOG.
7. Don't show moored or slow vessels... usually very helpful to clean up the screen. Might need to use a low speed since moored is a navigation status that only applies to Class A targets, so class B moored with AIS left on will bounce around a low SOG. How this selected SOG affects the dots on the targets is discussed above. Note in Figure 3 above, we see many moored vessels with black dots, but these dots are there because of their speed. These are mostly class B that do not send out navigation status, of which moored is one example.
8. Real size... might as well leave this on as it won't affect anything and if you are zooming way in to see vessels interact on the level of vessel dimensions, then this would have to be turned on. This latter operation requires you to set your own real size (menu Boat/Boat Settings/ Dimensions) if you are one of the interacting up close vessels.
9. Use VDO... This setting does not matter. Might as well leave it off. It is for the very rare case of vessels doing live navigation with qtVlm that have an AIS transponder in use but do not have an independent GPS. This option then lets qtVlm pull their position information out of an AIS NMEA sentence they are broadcasting, because AIS units always have their own internal GPS.
There are two types of AIS NMEA sentences generated by all AIS units. There are sentences that describe the targets they have detected; these always begin with
!AIVDM. The sentences that use the internal GPS of the AIS unit that describe your own position, COG, and SOG always begin with !AIVDO. NMEA AIS sentences, unlike GPS sentences, are fully encoded and cannot be read in plain language without an online tool to decode them. But the composition of these sentences does not matter to us. We just need to know how to identify an AIS sentence as it can confirm we are receiving the sentences we expect.
The main setup for CPA data is in the CPA/TCPA tab shown below.
Figure 17. AIS set up display options, CPA/TCPA tab shown in yellow. Blue is on, so in this example all options are turned on with the indicated values.
Looking at the options individually, keeping in mind that these are dynamic display options that you might change frequently as conditions change:
1. Calculate if less than... Can be a useful limit, but typically overridden by choices below. At sea you might leave this off to be alerted to traffic at your reception range, even if the CPA will not be an immediate concern. On inland or coastal waters, this would be used to rule out a computed dangerous encounter that meets all your other criteria but from a vessel you would not see for several hours or more... and even then assuming speeds and courses do not change.
2. Show if CPA and TCPA at these limits... These are the two key criteria. Choices depend on the circumstances. In the ocean, a couple miles is still a concern whereas that is typically a very large passing distance on inland waters. Use of the qtVlm simulator and near live internet AIS targets is a good way to get practice with this and experience on how CPA data show up with much traffic present. Transiting busy areas is a much bigger challenge than negotiating the safe passage of a single vessel. Practice in busy parts of Seattle's Elliott Bay, or even the more congested waters of San Francisco Bay or Chesapeake Bay, all of which are crisscrossed by high speed Ferries and much ship traffic.
3. Ignore moored targets... This is often needed to clean up the screen, but remember the parameter that actually shuts off the display is your choice of minimum low speed set in Options panel (Figure 16); it is not just those class A targets reporting nav status moored.
4. Ignore if crossing land... This will be needed in many cases to minimize unnecessary CPA displays, depending on the layout of the waterways, else you could see computed CPA data for vessels on the other side of a peninsula or breakwater. But in other cases, it could be crucial to shut this off to warn of actual encounters that might occur at meeting waterways. In a sense, shutting this off is shutting off one of the key virtues of the system. In many cases, the above criteria adequately limit the computations even with this shut off. Again, all of these settings are dynamic.
5. Use real size for calculating CPA... This can just be left on. It is required for analysis at ranges near vessel dimensions, and does not affect things at larger distances.
The final tab in the AIS set up choices is called Display.
Figure 18. AIS set up Display tab. Default would be leave these all on.
You can choose to show just one or the other AIS classes, but it would take a special circumstance that calls for that. Rarely do we need to know where the AIS Base Stations are located, so they could be turned off, but there are not many. It is rather like knowing where the local cellphone towers are located when using your phone.
Search and rescue (SART) airplanes is a defined AIS target type but the standards have not been established. You are unlikely to see any of these. SART targets is an option to set when using live AIS when you are looking for a MOB sending out a mobile AIS signal from a personal locator beacon (PLB). qtVlm offers a unique safety feature set up from the bottom right of the window shown in Figure 16, where you can enter the MMSI of crew members and then when SART is activated an alarm will sound and automatically drop a MOB marker on the chart when an identified MMSI target is first detected.
Audio and visual alarms can be set for that function and for other AIS detections in the Alarms section as shown below.
Figure 18a. AIS and other alarm options.
Some radar units with ARPA functions can export the ARPA target data to a NMEA sentence and when running live navigation with such equipment you can choose to show these ARPA targets on the screen. It is a backup check on vessels that might not be carrying an AIS transmitter.
ATONs are aids to navigation that include an AIS transmitter. These are valuable navigation aids, similar to using a RACON on some buoys. There are both real AIS ATONS and virtual AIS ATONS. Real ones can be on buoys, beacons, or bridge supports. Virtual ones can be anywhere, usually marking some key point in a waterway. They are shown on charts, so seeing the AIS version on the charted version offers some level of confidence.
Recall that real buoys can drift or be dragged off of the correct location. In Admiralty Inlet at the north end of Puget Sound there are very strong currents, commonly reaching 4 kts. In those waters was at one point the buoy SB, second in a sequence headed to Seattle. That buoy was dragged off station so often the USCG decided to remove it completely. Then a few years later there appeared a virtual buoy SB in the historic location.
Figure 19. A virtual AIS ATON. The ENC symbol is a circle with "V-AIS" label.
Another interesting application of the AIS ATONS, also with history to it, are the 5 virtual targets on the pylons of the Bay Bridge in San Francisco Bay shown below.
Figure 20. Top view shows the virtual ATON symbols on the ENC along with the pick report we get. AIS is not turned on. We learn from that (Source indication) that they were first put there as announced in USCG 11th District Local Notice to Mariners in the 13th week of 2014, which is online and confirms that. The AIS symbols are white and hard to see on this chart, so the bottom view shuts off the chart.
These ATONs were in effect put there following the
allision of the Cosco Buson with one of the pylons in 2007, resulting in a notable oil spill. It took seven years to implement these, because the full accident report took a long time and the technology was just emerging.
This is a famous incident for navigation students because the cause of the accident was traced to the ship's pilot not knowing how to read a vector chart, nor how to set up the tracking of the vessel on the ECS. The ship was being set by current and this would have been immediately obvious to anyone completing our course! There were RACONS at the time of the allision (a collision with a stationary vessel or object)
marking the path between pylons, but the pilot did not see these on the radar—RACONs are triggered by the ship's radar so they are not continuous on the screen. Another lesson was that a pilot on a lot of prescription drugs can be impaired!
This example is also a bit special in that the ATONs are called "virtual" when in fact there are real structures there that they are marking. With a virtual buoy or beacon there is nothing physical there.
Below are more samples of CPA display data.
Figure 21. Two CPAs computed. This one not a collision risk. Setting maximum CPA to 1.0 nmi would remove the CPA displays and just show two vessels passing.
Figure 22. Many targets being tracked. These could be cleaned up by limiting the maximum CPA to watch. Pictures like this can change notably with just slight changes in your course or speed. Also this type of picture is a good reminder that we must look out of the window and not just stare at the computer screen. It is easy to get mesmerized by such functionality in ECS and when looking at the many features of modern radar.
One practical approach is to monitor the vessels by sight without any being tracked and then when the interaction with any one of them is uncertain to right click it and show CPA data for it. Turning on the tracking data (also a right click option) is helpful as well, though not shown in Figure 22. With that said, the Navigation Rules remind us about use of radar to periodically look at the long range radar view for early warning, and there is a clear AIS counterpart to periodically track even distant vessels to see if there is any risk developing. In areas with shipping lanes, we know the tracks the ships will follow, so we can make longer term plans this way.
Referring back to Figure 8 that shows the options from a right click on an AIS target there is one called Show on Marine Traffic. If you have internet connection at the time, you can do this to learn more about the vessel, such as its maximum and average speed (as determined by its AIS history), usually along with pictures of the vessel. An interesting thing to check a few times to see how this works.