Thursday, July 23, 2020

Free eChart Viewers

This is the first step toward revising our 2013 article on this topic.

NOAA has announced the sunsetting of all paper charts and the associated raster navigation charts (RNC) beginning at the end of 2024. In short, starting sometime in early in 2025 we will all be using electronic navigational charts (ENC) and the new NOAA Custom Chart NCC printed versions of the ENC.

Starpath has made a custom link that is easy to remember that takes you to the place you can download free echarts in either the ENC vector format or in the more accustomed graphic RNC format, which are exact images of the paper charts.


If you are new to echarts you might not have a program to view these with, but there are several excellent free options available that can be used either permanently or until you choose a specific commercial version.  Also even if you do not intend to use ECS (electronic charting system) for your own primary navigation, these days it is only prudent to have all the charts you might ever need at hand as a backup. Even not using them for primary underway navigation, they are still the best way to layout a safe route, which can then be transferred to your active GPS via a GPX file.


Sample of the online NOAA ENC Viewer

There are hundreds of computer and tablet programs that display echarts in some form and also accept a GPS signal for moving map navigation. Together this is called an electronic navigation system (ECS).

To clarify our shortlist amongst these hundreds, we have these criteria:

(1) Must show either or both official RNC and official ENC.  A large number of these commercial ECS use third party vector charts that they produce themselves based on the official charts. These can be quite good and the products cost effective, but they are not included here.  A popular example of these would be the many Navionics products.

(2) Must be truly free, not just a temporary demo. Most all of the commercial products include some free demo period that serves to show the unique features they offer, and indeed it is worth checking out a few contenders. Prices range from $50 to $2,000 or so, with several popular products in the $300 to $500 range (Coastal Explorer, Time Zero, WinGPS, to mention just a couple we are familiar with.)

(3) Must be stand alone product for PC or Mac or mobile device. Thus we do not count several online viewers, notably the NOAA viewer for ENC and their NOAA viewer for RNC. Click the (i) icon on the ENC viewer to get into a cursor pick mode... either for a spot or region. These are essentially the same viewers we see at their chart selection options (see starpath.com/getcharts).

(4) We are not requiring live GPS functionality, just chart viewing, and we are not requiring coverage of encrypted ENCs or RNCs sold by other nations. These are called S-63 format ENC, whereas we are restricting to S-57 ENC.

In the original 2013 version of this article we had a list of over 20 products, and for now I will just leave these links here at the end, many of which are defunct. Two popular ones, Fugawi and Polar View, ended support in 2019. Memory Map Navigator is still a fine product, but no longer has a free version—we used Memory Map for very many years in our courses, before the time that OpenCPN developed. Memory Map was one of the first ever echart programs, in that it formed the basis for what is nominally the first one from MapTech, years ago. The other few left on the list also no longer have a free version.

In these old days, the free versions were often called "voyage planners" in that they would show the charts and let us set up routes and so on, but no live GPS. These seem to be gone now—I suspect largely pushed aside by OpenCPN and qtVlm, which have become such a powerful programs.

For now the shortlist that meets our criteria is so far:

(1) qtVlm  is an amazing full function free navigation program, well documented,  with many sophisticated features including optimum sailboat routing, tides and currents, Gribbed weather and ocean forecasts download and display, and georeferenced graphic image import. Its interface and presentation of the ENC objects and attributes is one of the best. There is Mac, PC, and Linux versions.  

The name "qtVlm" comes from Vlm standing for Virtual Loup-de-mer, which is an online sailboat racing simulator that can be used to participate in actual live races, such as Sydney-Hobart, Transpac and many other global races. There are over 12,000 participants. The "qt" part means it is developed using the Qt cross platform software tool—as such, I believe the convention is to pronounce this "Cute VLM."


Sample ENC viewed in qtVlm

(2) OpenCPN is a full fledged navigation program for both Mac and PC, plus Linux and Raspberry Pi, although some plugins are still PC only. It shows RNC and ENC and does a good job on the ENC presentation, but there are still a few minor things that are not quite standard, some intentionally so.


Sample ENC  viewed in OpenCPN

(3) SeeMyENC  offers A standard display is seen in this product from  Sevencs.  This is not a navigation program and it will not show RNC, but it does show all the S-57 objects and attributes of the ENC along with an chart viewing interface that is essentially ECDIS type compliant. The German company Sevencs is a world leader in both charting software and chart production.


Sample ENC viewed in SeeMyENC

(3) Win GPS ENC Viewer  is a free program from Stentec in the Netherlands. It includes unique links to the inland ENCs of European waterways which are also free product, although their coastal ENCs are not free.


Sample ENC viewed in Stentec's Win GPS ENC Viewer

Below are links from the original 2013 version of this article. I will come back to check these and finish this new version. Most of these are gone now, and since then we now have our book on ENCs. We can also discuss then the Caris product called Easy View that meets our requirements, but has rather a steeper learning curve. It will show both RNC and ENC, but is more oriented toward investigating the structure of the ENC file itself than a navigation chart resource.


—db, July 23, 2020

________________________________________________________

Global Navigation Software Co

Maptech

GPSNavX

Caris Easy View

Memory Map

Bluewater Racing

ScanNav

EarthNC

Tiki Navigator

----------------

There is also this list and note at NOAA (in 2013), which is directed toward ENC software, but there is no reference to free or demo. This old list was from NOAA at that time. They no longer have this long list and all of these need to be checked. The following note from NOAA was included:

"The following corporations/organizations offer a number of charting related products that may provide useful important information. This listing is provided as a public service for information only and neither the Office of Coast Survey nor the Government endorse any of the products or services provided by these corporations/organizations. Please note the links connect to Web pages outside of the Office of Coast Survey Web site."

Free ENC Viewers


Systems that use ENCs

ECDIS Systems

ENC Information


ENC Production Software and Tools


Wednesday, July 22, 2020

"Swirls" — An Introduction to ENCs, and Why We Like Them

As you may know, at the end of 2024 NOAA will have completed the demise of all paper charts and the associated RNC echarts. We will all be using ENC by then, both in the echart format and in the new printed ENC format, called NOAA Custom Charts, NCC.

With that in mind, whenever we see a charting question arise in class that brings to mind the use of ENC, we jump on it,  and this is such an example.

The latest version of paper chart 18465, Eastern Strait of Juan de Fuca,  has on it a notation "swirls" near 48º 12.3'N, 123º 16.2'W. Following standard chart practice, you would turn to Chart No. 1 to learn what this means, but you would not find the word "swirls" in that booklet, which we can confirm with a search of the PDF version.  This is not a new chart notation on this chart. It was there in the 90s and likewise in the 90s it was also not in Chart No. 1.

We will be right if we guess this is related to spinning water or eddies of some form, but we still like all symbols and abbreviations on the chart to be well defined—as indeed most are; this is an anomaly.

In the age of ENCs, however, we have another way to see what this might mean. We start by looking at the same spot with both the latest ENC and latest RNC as shown below.


Figure 1

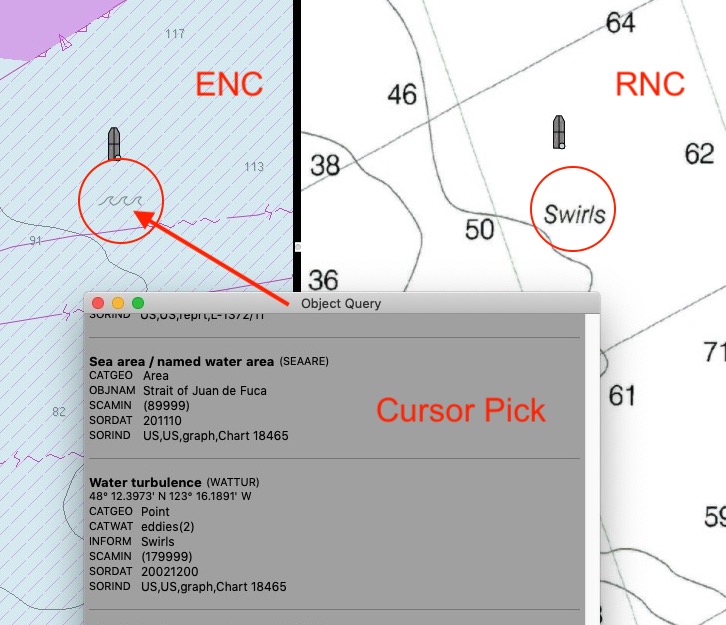
This view is from OpenCPN with the dual screen option. ENC on the left and RNC on the right set to the same scale, 1:21,300. (You can view the same thing in qtVlm, switching between vector and raster.)  Also shown is what ENCs call a "cursor pick," meaning I click the object (wave icon in this case) and up pops a list of the charted objects at that point, along with their individual attributes. We get nothing, of course, when we click any point on the RNC, as that is just a static image of the paper chart. In contrast, every point on the ENC brings up at least one object, and usually many.

Here we scroll the list to show just two objects, SEAARE (sea area), which is the Strait of Juan de Fuca, plus the subject at hand, the object WATTUR (water turbulence). The wave icon on the chart is the symbol for WATTUR. it is defined as: "The disturbance of water caused by the interaction of any combination of waves, currents, tidal streams, wind, shoal patches and obstructions."

Every object on an ENC has a 6-letter abbreviation, and although the official IHO display standard (S-52) discourages the use of abbreviations in favor of the plain-language names, our own experience is the abbreviations can be useful for communication, so we are glad to see OpenCPN include them. Here is the presentation of this object in an online S-57 object catalog from Russia (S-57.com). There is also an excellent US-Canadian version from Caris, but its URL is not as easy to remember!


Figure 2

Each object has in turn a set of attributes that describe the object, which are outlined above.  These attributes also have a 6-letter abbreviation, which could be confusing, but in practice once we get used to using ENC and the related terminology, it is not an issue.

Type A attributes are actual characteristics of the object; type B are relevant to the use of the object data; and type C relate to the sources of the data. Crossed out ones are no longer used. Underlined are mandatory for every example of that object.

We come back to the other information on this screen, but now just note that this object has attributes:

CATWAT (category of the water turbulence), 

OBJNAM (name of the object), such as famous "Liddel Eddy" in the Orkneys,

SCAMIN  (the minimum scale that shows the object on an ENC), and the last one we cover here,

INFORM, which is a text description of the object, described as:  "The textual information could be, for example, a list, a table or a text. This attribute should be used, for example, to hold the information that is shown on paper charts by cautionary and explanatory notes." This attribute is the key to the present discussion.

Object attributes are often categories, such as CATWAT, listed above, which can take on the values, which are defined in either of the two online object catalogs mentioned:


Figure 3

These categories are defined as:
1. breaker: a wave breaking on the shore, over a reef, etc. Breakers may be roughly classified into three kinds, although the categories may overlap: spilling breakers break gradually over a considerable distance; plunging breakers tend to curl over and break with a crash; and surging breakers peak up, but then instead of spilling or plunging they surge up on the beach face. The French word 'brisant' is also used for the obstacle causing the breaking of the wave. (IHO Dictionary, S-32, 5th Edition, 540) 
2. eddies: circular movements of water usually formed where currents pass obstructions, between two adjacent currents flowing counter to each other, or along the edge of a permanent current. (IHO Dictionary, S-32, 5th Edition, 1560)
 3. overfalls: short, breaking waves occurring when a strong current passes over a shoal or other submarine obstruction or meets a contrary current or wind. (IHO Dictionary, S-32, 5th Edition, 3631)
4. tide rips: small waves formed on the surface of water by the meeting of opposing tidal currents or by a tidal current crossing an irregular bottom. (IHO Dictionary, S-32, 5th Edition, 5494)
5. bombora: a wave that forms over a submerged offshore reef or rock, sometimes (in very calm weather or at high tide) nearly swelling but in other conditions breaking heavily and producing a dangerous stretch of broken water; the reef or rock itself. Also called bumbora or bomborah. (Australian National Dictionary)
Referring back to Figure 1, we see that the cursor pick reported CATWAT = 2 for eddies, but then we see the interesting note that INFORM includes the single word "swirls," which is indeed intended to link this ENC symbol to what is on the paper chart.

I can't really say "in short" after all that, but we can get a glimpse now of how an ENC can provide more information about charted objects.  On the paper chart, we see the word "swirls" only, and that word is not in the main reference Chart No. 1. In passing, it is also not in the more fundamental IHO charting standard called S-4 (Regulations of the IHO for International Charts). Nor is it in the IHO Dictionary, S-32.

In this case, that one word is all we get in INFORM, but it could hold up to 300 characters of information and tell us more, such as what stage of the tide it is most pronounced, and so on. The attribute TXTDSC (text description), will generally include any notes from the US Coast Pilot about this object. This is the way that ENC puts chart notes near or on the objects they describe.

You could say that this is a lot of work to learn that swirls means eddies in this case, which we might have guessed, but it could also have been tide rips, but that is not really the point here. Here I just want to use this as an introduction to how ENC data are presented as we transition into all ENC in a couple years.

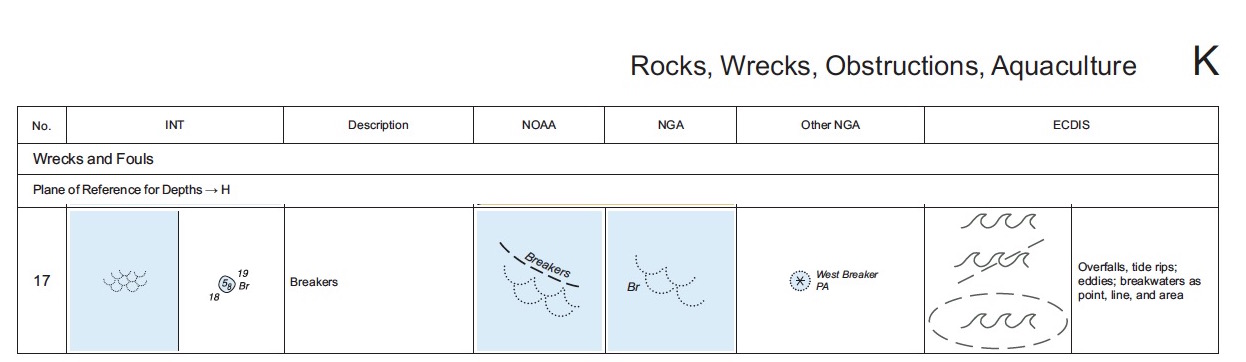
With that in mind, let's look at one other detail. In Figure 3 from an online object catalog we see that in this presentation of the attribute CATWAT we are also given the corresponding paper chart object locators. "INT 1" refers to the US and other national Chart No. 1 documents; the S-4 numbers refer to the IHO S-4 document linked above.  The S-4 presentation is shown below,  followed by the Chart 1 presentations.


Figure  4.  Chart symbols according to S-4


Figure  5.  Chart symbols according to US Chart No. 1

This is just another way we can correlate ENC symbols (new to some mariners) with the paper chart symbolism we are accustomed to.


Sunday, July 19, 2020

A Sight Reduction of the Sun

This is an outline of the process using our Starpath Work Form 104. The exercise is from our Online Cel Nav Course, Quiz 3 Question 16 (CN03-0016). Following the outline here is a link to a video with more discussion.

Here is the exercise:
For this exercise we use the 1978 Almanac data from our textbook, but we have to use a full set of Increments and Corrections and we need a full set of Pub 249 vol 2.

Forms, Sight Reduction Tables, Increments and Corrections, and indeed even the Almanac data can be found at starpath.com/celnavbook.

Below is the filled out form, which is the answer to the question, followed by notes on where each of the values come from. We ask our students to follow through on this example to understand each step following the instructions in Chapter 3 of the textbook, which covers each Box in the form.  We also have a book (Starpath Celestial Navigation Work Forms) that explains our forms step by step, with several examples. It is effectively a short course on cel nav.

Below is just a very short discussion, not intended to replace what is in the textbook.


Box 1 is the sight data, all given for any sight.

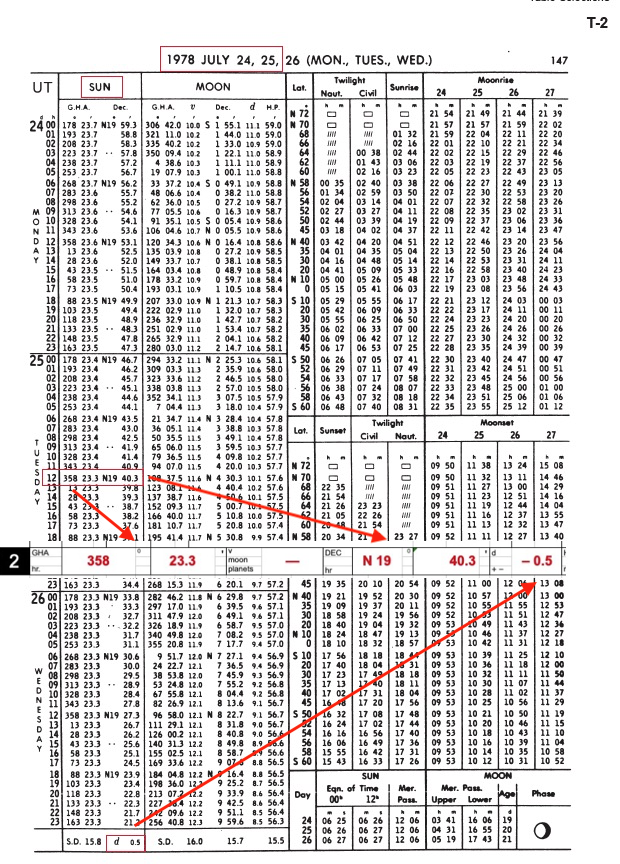
Box 2 and 3 are the look ups for the GP of the sun at sight time. first the whole hours part from the daily pages of the Almanac, then the minutes and seconds correction from the Increments and corrections tables.


Increments and corrections for Box 3.


Add up hour and min-sec parts to get GHA. Then choose the assumed position (AP = a-Lat, a-Lon).  Round the DR-Lat to nearest whole degree to get a-Lat, which is 38º N.  Then choose the a-Lon to be the closest Lon to the DR-Lon that has the same minutes as the GHA. In this case a-Lon = 1º 55.6'W.  We cannot use 45º 55.6' because that one is more than 30' from the DR Lon. (We have extended practice with choosing the a-Lon in Section 11.13 in the textbook.)

With these values we can then find final LHA = GHA – a-Lon, and fill Box 4 that we need for the sight reduction tables and then turn to Pub 249, Vol 2 for Lat 38, Same Name, Dec = 19, LHA = 317. which we find on the page below.


Now we get the correction to Hc based on d value and Dec minutes.  Then we add this correction to tabulated Hc to get final Hc, completing Box 5.  Hc = 48º 34.2' 


Now we do the right side of the form to convert Hs to Ho, and then we compare Ho to Hc to get the a-value. Plus convert Z to Zn and we are done.

For the IC we use the rule "if it is on, we take it off," so this is -1.0'. We find the dip and altitude corrections from the Nautical Almanac page shown below:


To find the correct altitude correction, first note the date.  We are July which is between April and Sept. Then check we are Lower Limb, then go down the column to find Ha.  We always want the center of the body, so LL means this is a + correction; UL this will be a – correction.

Now use the rules on the form and on every sight reduction tables page that tells us how to convert from Z to Zn, as in previous image. 

Then subtract Ho and Hc, smaller from larger and that is the a-value and take the label next to the largest. In this case our LOP is a = 11.6A from 105T.  We plot this from the AP 38N, 44 55.6W.

You can always check your work with Celestial Tools, SR & Fix function as shown below:


This shows all the values you should get on intermediate steps. Note that Celestial Tools rounds dec and dec corrections to whole minutes, which is the official Pub 249 procedure. We get slightly different values as we interpolated the d correction. (In this case we end up about 0.2' more accurate than had we rounded. In other cases it could be as much as twice that better, but indeed in a few cases, this rounding will make things worse by a couple tenths.)


Friday, July 17, 2020

A Sight Reduction of Jupiter

Here is the exercise we will solve. It is from our Cel Nav Course, Quiz 8, #19 (CN08-0019).  This is an outline of the solution. At the end is a  28 min video discussing each of the steps. You can click each of the images below for a higher res view.


Resources used can  be found at starpath.com/celnavbook


Here is the filled out work form. Following that are pages from the Almanac and Pub 249 Sight Reduction tables used. You might print out this completed form and follow through the steps below.

We also have a book (Starpath Celestial Navigation Work Forms) that explains our forms step by step with several examples. It is effectively a short course on cel nav.


Box 1 is all from the given sight data in the question. 

(For this exercise we are using the DR position given at 0300, whereas the actual sight was at 0410. In principle it would be best to DR to the time of the sight, and use that value to choose the assumed position. This is addressed at the end of the article.)

Box 2 is from daily pages of the Nautical almanac


Box 3 we get from the Increments and Corrections pages. 


Now that we know GHA we can choose the assumed position (AP = a-Lat, a-Lon).  Round the DR-Lat to nearest whole degree to get a-Lat, which is 30º S.  Then choose the a-Lon to be the closest Lon to the DR-Lon that has the same minutes as the GHA. In this case a-Lon = 115º 7.4' W. 

With these values we can then find final LHA = GHA – a-Lon, and fill Box 4 that we need for the sight reduction tables and then turn to Pub 249, Vol 2 for Lat 30, Contrary Name, Dec = 18, LHA = 322. which we find on the page below.


Write these values for Hc, d and Z into Box 5. Now we need to look up the d correction

Our d value is -52, our dec minutes are 43.8. We note that dec min 43 has correction 37 and dec min 44 has correction 38, so we can interpolate by eye to get our correction as 37.8, which is minus and this goes into Box 5. And we find the final value of Hc = 34º 18.2', which we copy to the right side of the form, following the arrows.

Also figure Zn from Z, using the rules on the work form. These same rules appear on every page of the sight reduction tables as well. Here we are S Lat with LHA > 180, so Zn = 180 - Z. Figure that and add to the form.

Now we convert Hs to Ho on the right side of the form.

We get dip and altitude correction from the Almanac page below:


Add these to the form and sum up to get Ho. 

Note that the two closest planets Venus and Mars can have an additional alt correction, which will be in the middle column. These are dependent on the year. Jupiter and Saturn do not have these.

Now subtract Hc and Ho, smaller from larger to get the a-value, and label it with the letter next to the larger of the two... or use the jingle "Calculated greater away" or "If
Ho is Mo it is To."

So the answer the question is: (a) Assumed position is 30º S, 115º 7.4' W and (b) the LOP is a = 0.9'A from 033.
______________

Two last thoughts to wrap up this exercise:

(1) The DR position given was earlier than the sight time, so in principle we should DR from 0300 to 0411 to find the right DR to use for choosing the AP.  This plot is shown below:


We see that the new DR does not affect our choice of AP. This step, however, should be checked for all exercises like this one.

(2) We have a useful training tool in Stan Klein's Celestial Tools.  The option called "SR Methods & Fix."  This unique function shows what you should get at each intermediate step in a sight reduction depending on which method you select. Here we chose Pub 249, v2 or v3. We see below that he computes what we see in the form.  Check out this neat tool as a way to verify your work... especially as you move on to using the NAO tables (he calls them NASR) or or Pub 229.


____________

To see a video of the above notes with more discussion see below (caution, it is 28 min long!)