Thus we are left with only very general comparisons during those incidents when the boat position coincides with an unusual current forecast, such as very favorable or very adverse. At times we have had some indication that this might work, but for the most part this has been very discouraging exercise. But the problem is not just the measurement. What we have learned well is the various forecasts available do not agree with each other, so this has become a really hit and miss exericise.
To illustrate this point, we show here the predictions from five sources, which are more or less independent of each other. We also show what the same data looks like when obtained from different sources.
In each of these five cases we have marked two regions to compare the predictions. The top one is about where the boat is at this moment. The bottom one is just marking another area for comparison. But it is easy to focus on other areas for comparison as the maps are all on about the same scale.
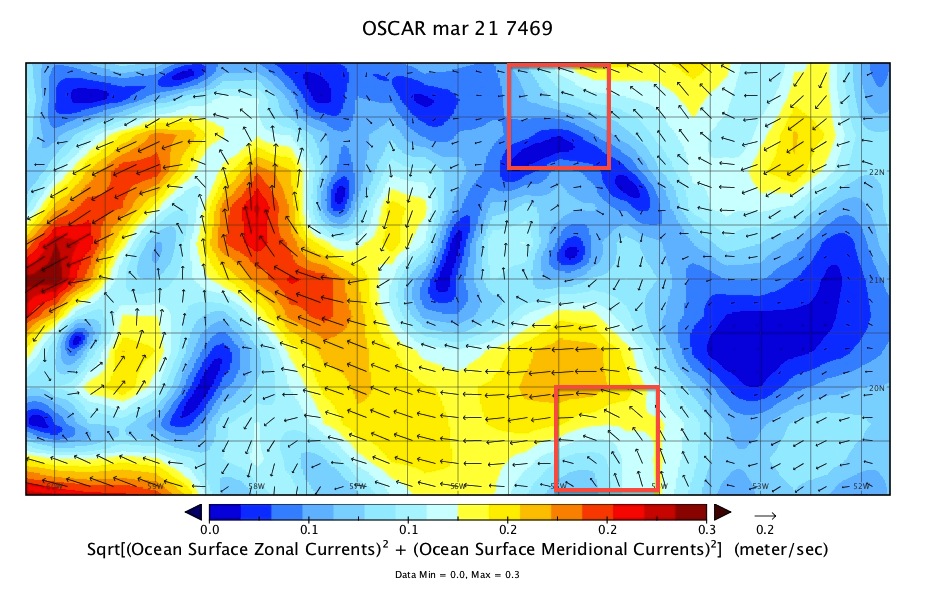 |
| From http://podaac.jpl.nasa.gov/dataset/OSCAR_L4_OC_third-deg |
 |
| From ftp://ftpprd.ncep.noaa.gov/pub/data/nccf/com/ofs/prod/ |

 |
| Global HYCOM model from OCENS.com via WeatherNet |
 |
| US Navy Global NCOM from http://ecowatch.ncddc.noaa.gov/erddap/griddap/NCOM_sfc8_agg.html |
And we see immediately the problem. These are the latest data from each of these sources. Not only do the speeds vary by huge amounts, even the directions are reversed in some cases. If you see two that agree in the top box on some level, they will much disagree on the bottom one, 180 nmi south.
Another big difference not shown here is the RTOFS data do vary notably from day to day, even hour to hour, within a general pattern, and the OSCAR data are essentially sliding averages over the past 5 days.
In any event, our great excitement about predicting ocean currents underway has to be put on hold for awhile till we learn more.
One thing that is encouraging is that two of the popular models have data available to mariners underway in GRIB format at no charge, that is the RTOFS from ViewFax and the OSCAR data from www.svsarana.com. These are shown below as they arrive from these services, which can be compared to what they look like in the displays above created in Panoply from the raw data.
 |
| OSCAR data delivered by email from svsarana.com and displayed in ViewFax |
 |
| RTOFS data downloaded and displayed from ViewFax |
These data do not agree with each other, but they do agree with the primary sources that we show in the top pictures. We can hope that one of these turns out to be useful.
For the moment, we are leaning toward the OSCAR data for our application, primarily because we have several indications that the RTOFS speed predictions are quite a bit high.... however, I must state immediately, we do not have proper scientific measurements of this. It is clear that the two models do not agree, that we can see easily, but which one is right or at least best, we do not know.
The indirect data we get is whenever the boat is forced to go onto a sea anchor because of bad seas. Then we get an indirect measure of the current from the COG and SOG as they drift.
Here is another bit of data which favors the OSCAR results, which is the track of the boat over the past couple days viewed in Google Earth. During the time they were in a steady favorable 0.3 kts according to OSCAR, the boat did indeed make progress in the direction of the current at roughly this much faster than their best rowing speed, ie they had their best 24 hour run of the trip, averaging about 3.0 kts.

No comments:
Post a Comment