Thus it is no surprise that we appreciate related valuable contributions to this field. One that we have known about, praised, and used for many years is the subject at hand. It came up today in class when a student was following one of our course exercises on calibrating his own barometer using online pressure resources, in particular an airport pressure reported in the form of a metar.
Essentially all airports around the world offer pressure data in this format, which is available hourly in plain language, giving sea level pressure in the form of QNH (called "altimeter" in these reports) or QFF (called "sea level pressure"). Both are pressures relative to sea level; the latter is closer to what the weather maps use, although these two pressures do not differ much unless the airport is high or the ambient temperature is extreme, or changed a lot in the past 12h. We have notes on this topic (and related one on temperature dependence of the conversions).
When we use one of these reports, or in fact any of the "official" reports, we tacitly assume the data are accurate, which is frankly—on the level we care about—not always the case. Luckily, we have a very easy way to check this, which brings us to the Gladstone Family project run by Philip Gladstone.
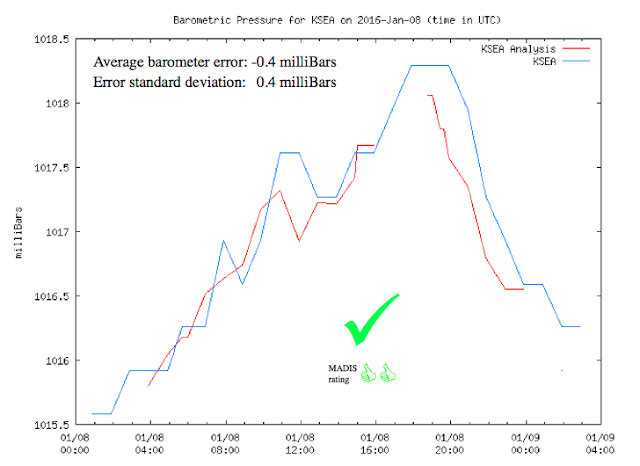
The Gladstone Family website is a wealth of airport weather related information, but the part we address now is his monitoring or compiling of daily accuracy records of all the pressure sensors used in the metar reports around the world. Samples below are for an airport having some troubles at the moment and one that is doing just fine.
 |
| Two reports on pressure sensor accuracy from the Gladstone Family |
It is always valuable to check his report when using one of the airport stations for barometer calibration data. I wish we had such a convenient service for the buoy and lighthouse data we get from NDBC.
For completeness I should also mention our own free service for doing something similar, using all official sources, including buoys and lighthouses, as well as airport metars.
You can read about how the Gladstone Family reported accuracy is determined. As I read this, they use the same methods the NWS uses to evaluate ship and other station reports before incorporating the observations into the model forecasts.
Our free online service works differently. It is located at starpath.com/barometers. There is a detailed help file with an explanation of the process there. Briefly, we do this:
You enter the Lat-Lon of your barometer, and we find the nearest 10 stations to you that have accurate pressure online. Then you look at a plot of their location relative to you, so you can decide which 4 or 5 (or more) offer a uniform distribution of references in all directions.
At this point you could just choose the closest one and use that, but you can do very much better. Print out our form for entering pressure data for this application. Then select at least 4 of them, and go to each one and record two times and two pressures that span a time you have a pressure recorded from your own barometer. Once you have these 4 or 5 sets of data, enter them into the online version of the form and submit.
Our program will then normalize them all to a common time, and then do a least squares fit to a 3d pressure surface that spans this area, and then it drops a point at your Lat-Lon, which is equivalent to an average of all nearby sensors. This is an accurate sea level pressure value you can use for your calibration at a specific time.
But this is not yet analogous to the Gladstone Family service. So far we have only found an accurate pressure, but do not know its uncertainty. The figure below is the final output from out method, and the numbers on the right are related to this question.
The bottom line is the best estimate of your SLP at the time given. Pavg is the reported pressure at each station, normalized to the one common time. Pcomputed is the pressure we get from our computed surface at each station at this time. Delta is the difference between these two, which is a measure of how consistent that station is with its neighboring stations. If all stations agreed precisely, these deltas would all be zero.
In the example shown, we see that #1, 3, 4, and 5 are all consistent to within ± 0.5 mb, which is about all we can hope for. #2 is questionable, but OK. The one that stands out is #6, off by more than 2 mb relative to the others. When something like this is observed, we should just remove #6 from the list and do the pressure surface computation again, and generally you will see all deltas get smaller and the resulting pressure for your location will be better.... maybe not much, but better.
Thus we also have this way to check the accuracy of a pressure report, but I will be the first to agree that the neat presentation of the Gladstone Family data is extremely valuable and we are grateful for the time he has spent on developing and maintaining that fine service.
To use the Gladstone Family service, look up the 4 letter metar code for the airport in question, ie google "seatac metar" to learn it is KSEA, and then google "gladstone family ksea."
§§§


No comments:
Post a Comment