ENC Display Modes and Option to Hide Unneeded Lines
Electronic Navigational Charts (ENC) are unique in nautical charting in that the user can define what level of detail they want to see on the computer screen. There are three IHO categories of display modes the user can choose from (Base Display, Standard Display, and Other); on top of those, the user can choose depth area colors, hide or show soundings, lights, ATON labels, among other choices. These details are not the subject at hand here. We cover them in our textbook on ENC.
Here I want to review the display modes, and make a specific configuration proposal for cleaner displays in areas with shipping lanes or other Traffic Separation Schemes.
Below is a sample of the Base Display mode. This is officially described as not adequate for navigation; it is intended to represent objects that must remain in place for all other displays.
Base Display mode. Clearly not enough info for safe navigation, but could be useful for some weather work or route planning.
Below is the Standard Display mode, which is thought to cover most navigational needs, and recommended as the default display mode for echart nav programs when first opened.
Standard Display mode. Covers many needs, but still missing sometimes crucial data of soundings and contours, tide rips, and others. Standard includes all Base Display objects.
The full display of all objects is the combination of Standard and Other, which is usually just called "All" on most nav programs. A sample is below.
All objects display mode. This is typically too congested for most applications. The triangle objects with asterisks inside are Quality of Data objects, which we generally want to hide. Recall to see details in any Blog post image, click it, then right click, then view in new tab and then zoom in.
Because Standard display is missing some things we might want to see, but All display is too much data, most programs offer some way to customize the selection of objects. qtVlm, for example, does have a custom display option, discussed below, but they include another that might meet most requirements most of the time, which is called the Detailed Display, shown below.
Detailed display from qtVlm. This display is the same as All display above, but it honors a set of choices that you make in the set up page shown below.
Detailed view set-up options. The Detailed view is the intended workhorse display mode. it shows all objects but respects your choices made on this page marked in red. The Quality of data symbols are removed by shutting off the Chart information objects. This view also respects the scale minimum setting for each object as well as how you have modified it here. See our online course in electronic charting for details on these settings.
The detailed does indeed work well for most applications, but we can clean the chart up a bit more if we remain vigilant of what we are hiding. The detailed view shows all the cables and power lines crossing the waterway, which complicate the chart when we are also trying to identify, say, traffic lanes in a an are.
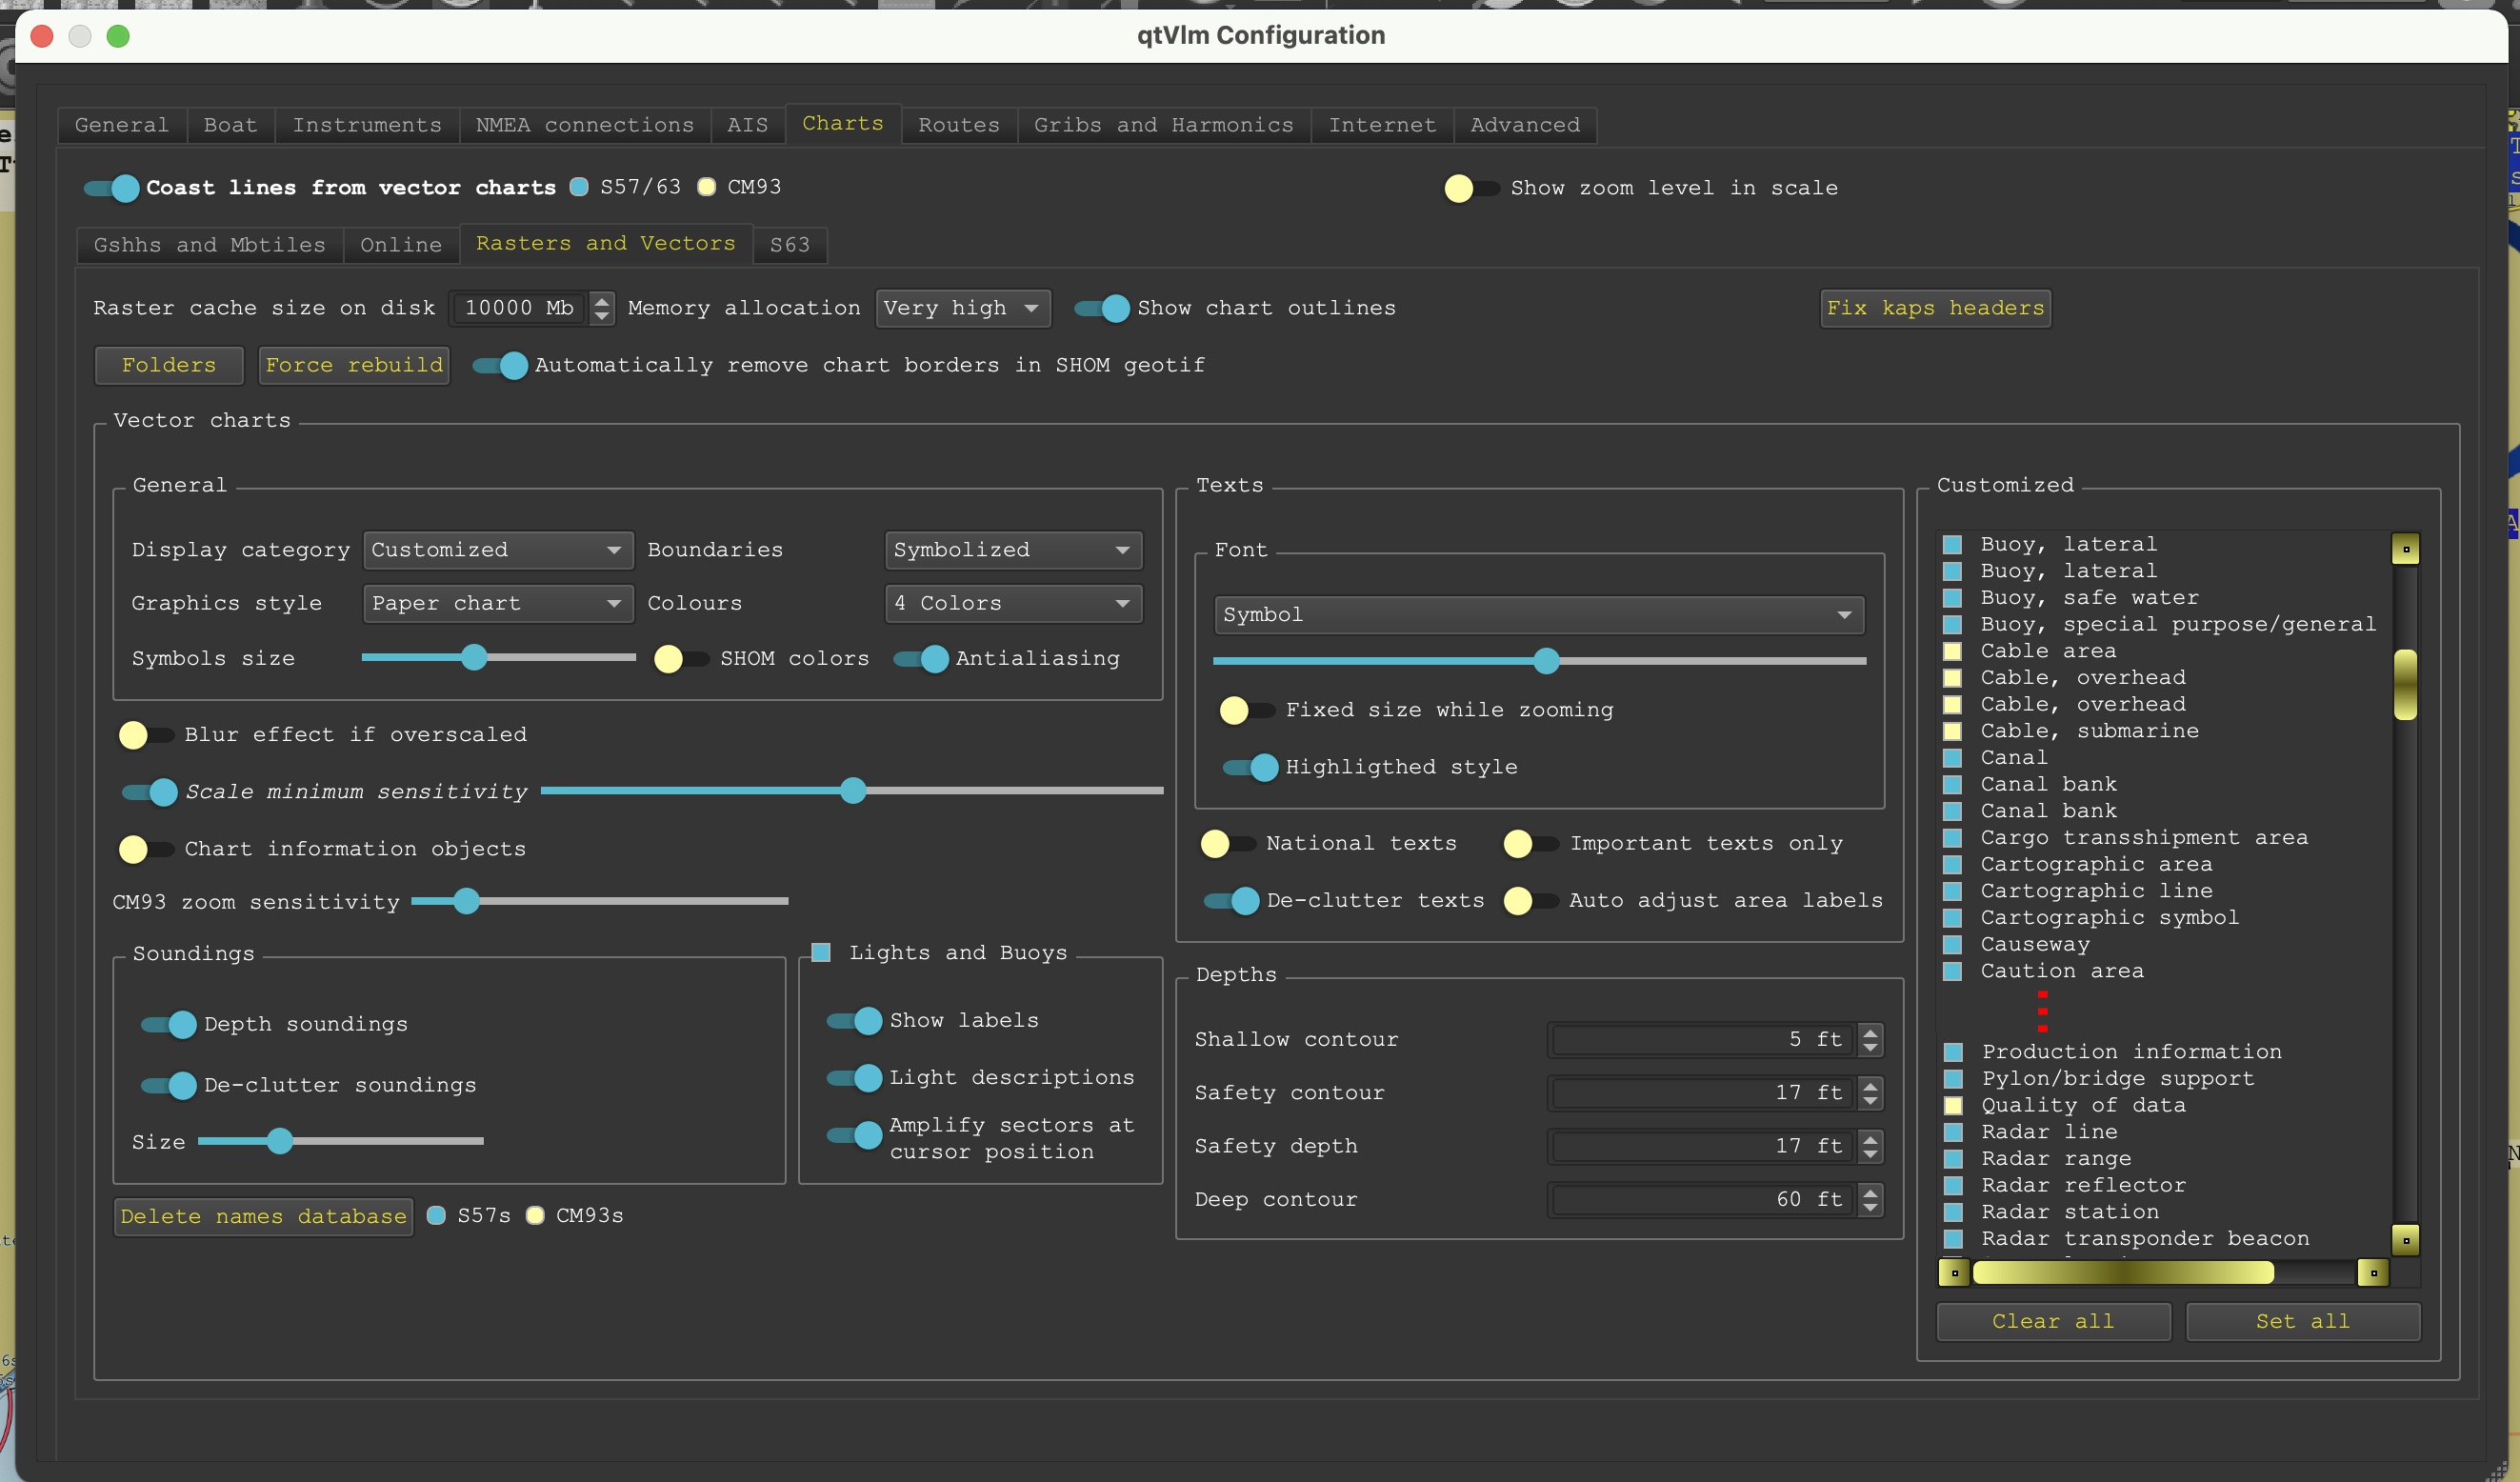
Thus we have another option of using the Custom display mode, which starts with all objects, and then we turn off the ones we do not want to see. In this case we shut off the quality of data objects and all the cable objects as shown below.
Custom set up options. Here we turn on all objects and then shut off the Cables and Quality of data objects
This creates a clean display with traffic lanes clearly standing out, which is good for an area like Puget Sound and other waters that have crucial traffic lanes crisscrossed by numerous cables. An example is shown below.
Custom display of all objects except cables. A clean view, but we want to turn the underwater cable display back on if we are going to anchor in this area. The lines left are the shipping lanes and the ferry routes, both of which become mored detailed as we zoom in the view.
That completes a long introduction to the possible value of using custom display to declutter the chart of cable crossings. Again, when anchoring we need to turn on underwater cables and pipelines.*
Here is a video on this topic more generally:
ENC Object Display Modes
_______________
* Object PIPSOL (pipelines, submarine/onland) are similar to object CBLSUB (cable, submarine) in that they both have an attribute BURDEP (buried depth) that tells us how deep the object is below ground underwater, but this is not a required attribute, so we do not often see it given.
In Oct last year a ship did drag anchor in a storm which led to damage of a pipeline that led to an oil spill off of Huntington Beach, CA. The pipeline involved is shown below.
Section of ENC number US4CA60M. The dashed lines with circles are pipelines. We see a pipeline running SW from the west most drilling platform with a pipeline and cable running north out of it. The other platform has a pipeline to shore. Presumably the ship dragged out of Anchorage Area F which has a pipeline right at its SE border. I am not sure which pipeline was damaged, but likely one to the right or left of the vessel icon shown with a blue circle.
.jpg)


No comments:
Post a Comment