Magnet variation (magvar) is crucial to marine navigation. It is the difference between true north and the direction of north read from a compass card, which is shown on the compass rose on a chart as the difference between true north and magnetic north. We might like to navigate by all magnetic bearings since we drive the boat by the compass, but we cannot avoid dealing with true bearings at times. Tidal current directions are always given in true, as are wind directions from any official forecast or observation. Charted navigation ranges are given in true, as are the visible boundaries of sector lights. Any cel nav solution must be worked out in true bearings, and so on.
In short, we might avoid them whenever possible, but we have to deal with true bearings. But that is navigator talk. Normally you would communicate related results or desired courses to the helmsman in magnetic and you would expect all logbook entries to be in magnetic.
Working with magvar is just one more aspect of navigation that is improved with the use of ENC. Magvar is an ENC charted object, and we can cursor pick any place on the chart to see what the local value is at that point. ENC get the latest values (magvar drifts slowly with time) from the World Magnetic Model (WMM), which is updated every 5 years on the even 0s and 5s. The most recent is 2020; next update is 2025.
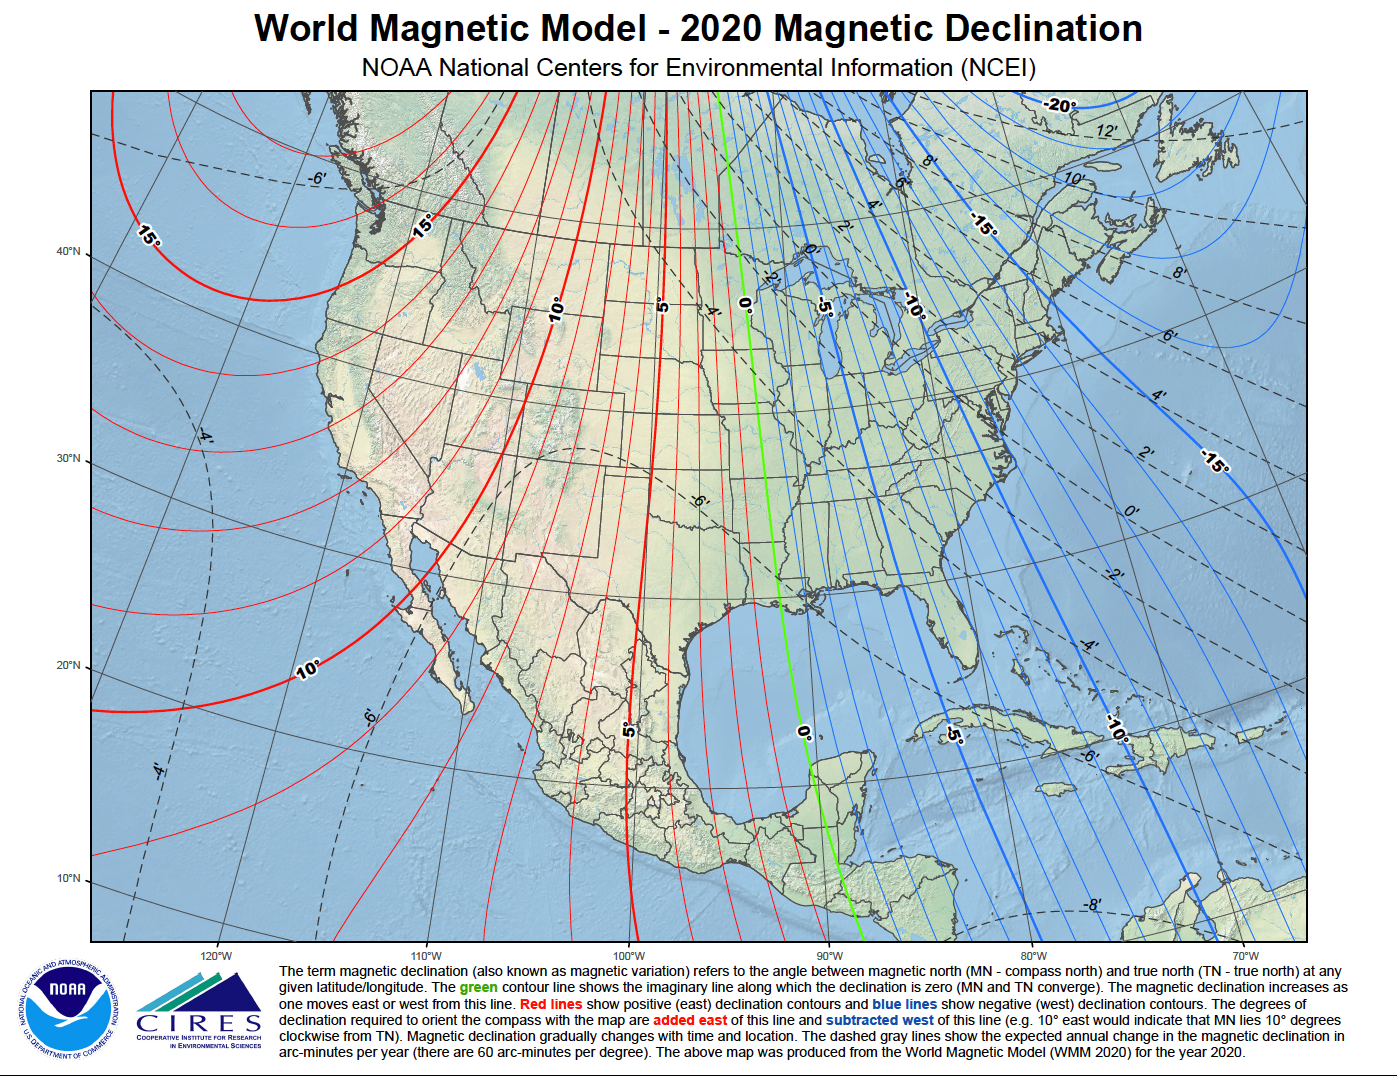
The image below shows how magvar varies over the country, along with its annual rate of change.
Most current (July 2022) ENC have the 2021 values encoded in the charts (corrected from 2020 WMM), whereas the latest paper charts or the raster navigational charts (RNC) made from them could be very old. Two examples are below.


This latest printed chart value is from 2017, which means corrected from 2015 WMM. At 2022 we have 5 yr x 9'/yr = 45'=0.75º, which implies a current magvar of 15.25º E. We find the actual value from the latest ENC below.
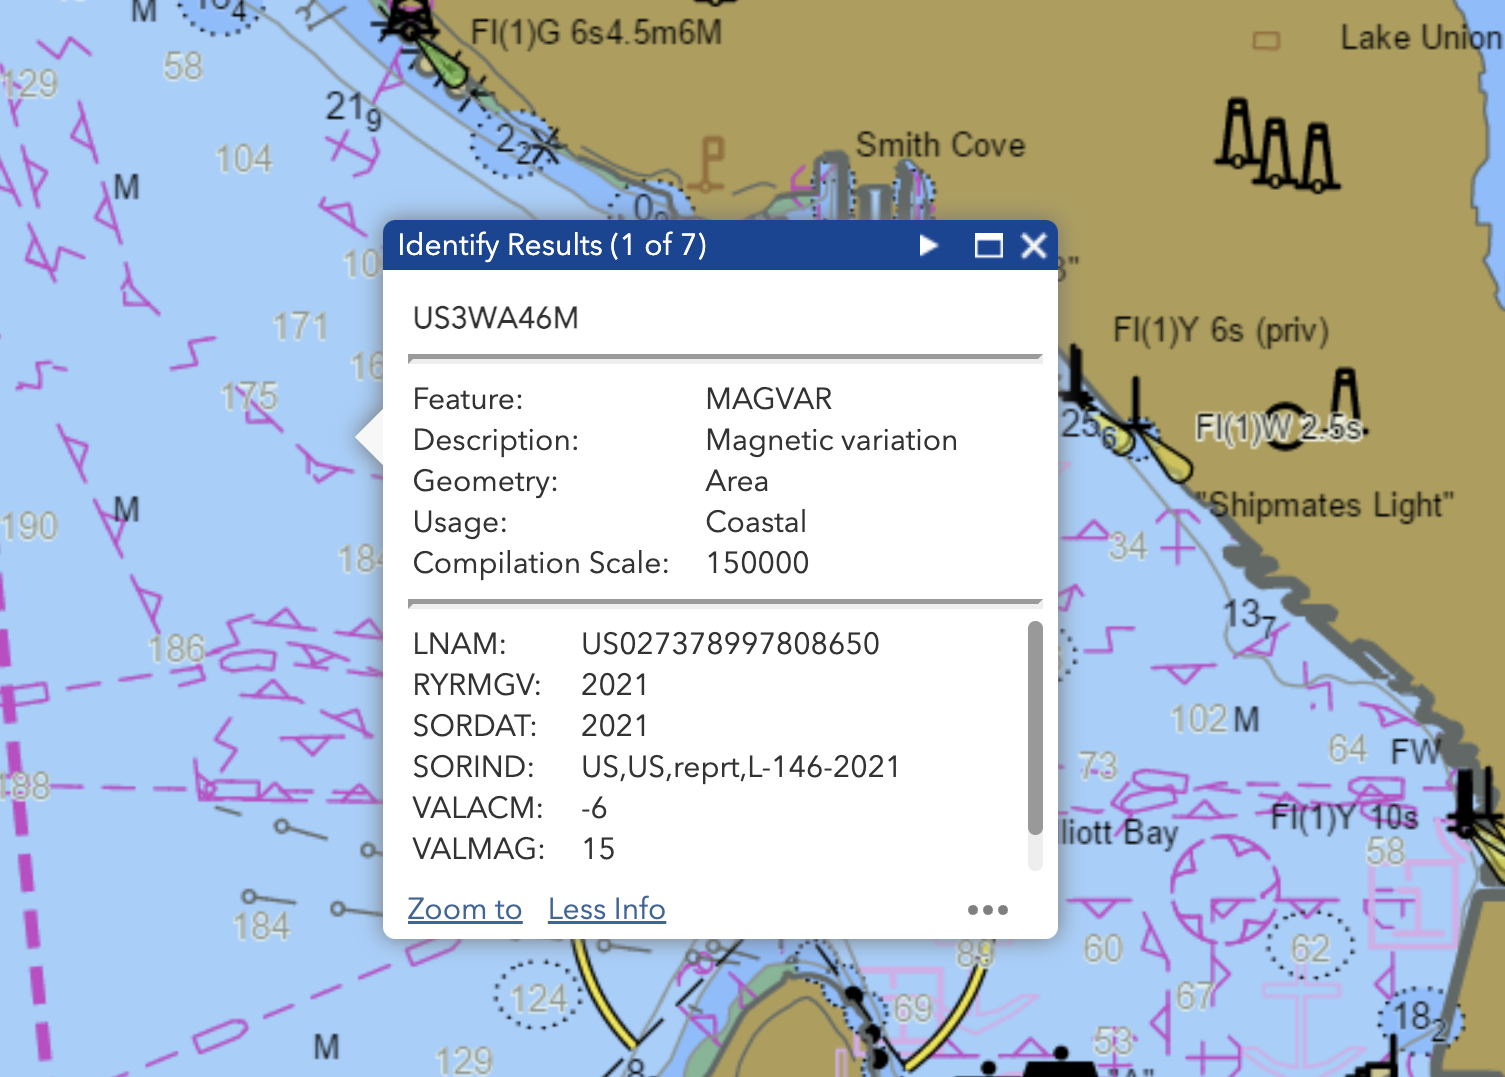
An ENC pick report using the NOAA online ENC viewer. Here we are reminded that some ECS use only plain language names of objects and attributes, whereas others use only the so called acronyms (actually just abbreviations) for them... and some use both or offer the option, which is my preference.
The object is magnetic variation (MAGVAR); the attributes to this object are:
LNAM = "Long Name" a combination of several object ID parameters (not related to navigation; it is an object identifier, not an object attribute; rarely if ever shown in ECS)
RYRMGV = Reference year for magnetic variation
SORDAT = Source date, which, in this case, is date the data was posted
SORIND = Source indication, which is where the data comes from, an internal NOAA doc number.
VALACM = Value of annual change in magnetic (in arc minutes per year)
VALMAG = Value of magnetic variation (in whole degrees for an area magvar report.)
We always use RYRMGV for figuring the annual change, not the Source Date. In 2022, we have only a 6' change, so the actual variation at the moment is still 15º E, which is essentially what we got from the old data on the printed chart. This means that the rate of change changed at Neah Bay, but not so much here in Elliott Bay. It also shows why updating this magvar data is not a crucial paper chart update in most cases, and hence is not being done.
______
With those basics behind us, there are a couple more subtleties regarding magvar in ENC. Below is an expanded section from our book Introduction to Electronic Chart Navigation.
2.13 Magnetic variation
We can get spoiled using ECS navigation, because we just push buttons to switch back and forth between magnetic and true directions. In a dark sense, we don’t even need to know what the variation is. It is rather like not needing to know how to divide, since we have a calculator in our phone, or how to spell, when there is a spell checker in everything we write with. This is just a small part of the slippery slope of electronic navigation, but still one to be avoided.
Magnetic variation (MAGVAR) is an S-57 object that can be encoded into an ENC as either an area or a point object. Area examples are shown in Figure 2.13-1. Some hydrographic offices include this data, but others (i.e., Canada) do not—inland ENC (Appendix 8) do not include MAGVAR in either the US or international versions. When MAGVAR is present as an area object we can find the value of the variation with a cursor pick at almost any place on the chart. The object has a scale minimum attribute (SCAMIN), so it might not be reported on all display scales. On NOAA charts, the SCAMIN value for MAGVAR seems to be the same as used for the soundings, so if you can see soundings you can see the variation symbol, and if not, you can’t—assuming the soundings display has not been turned off.
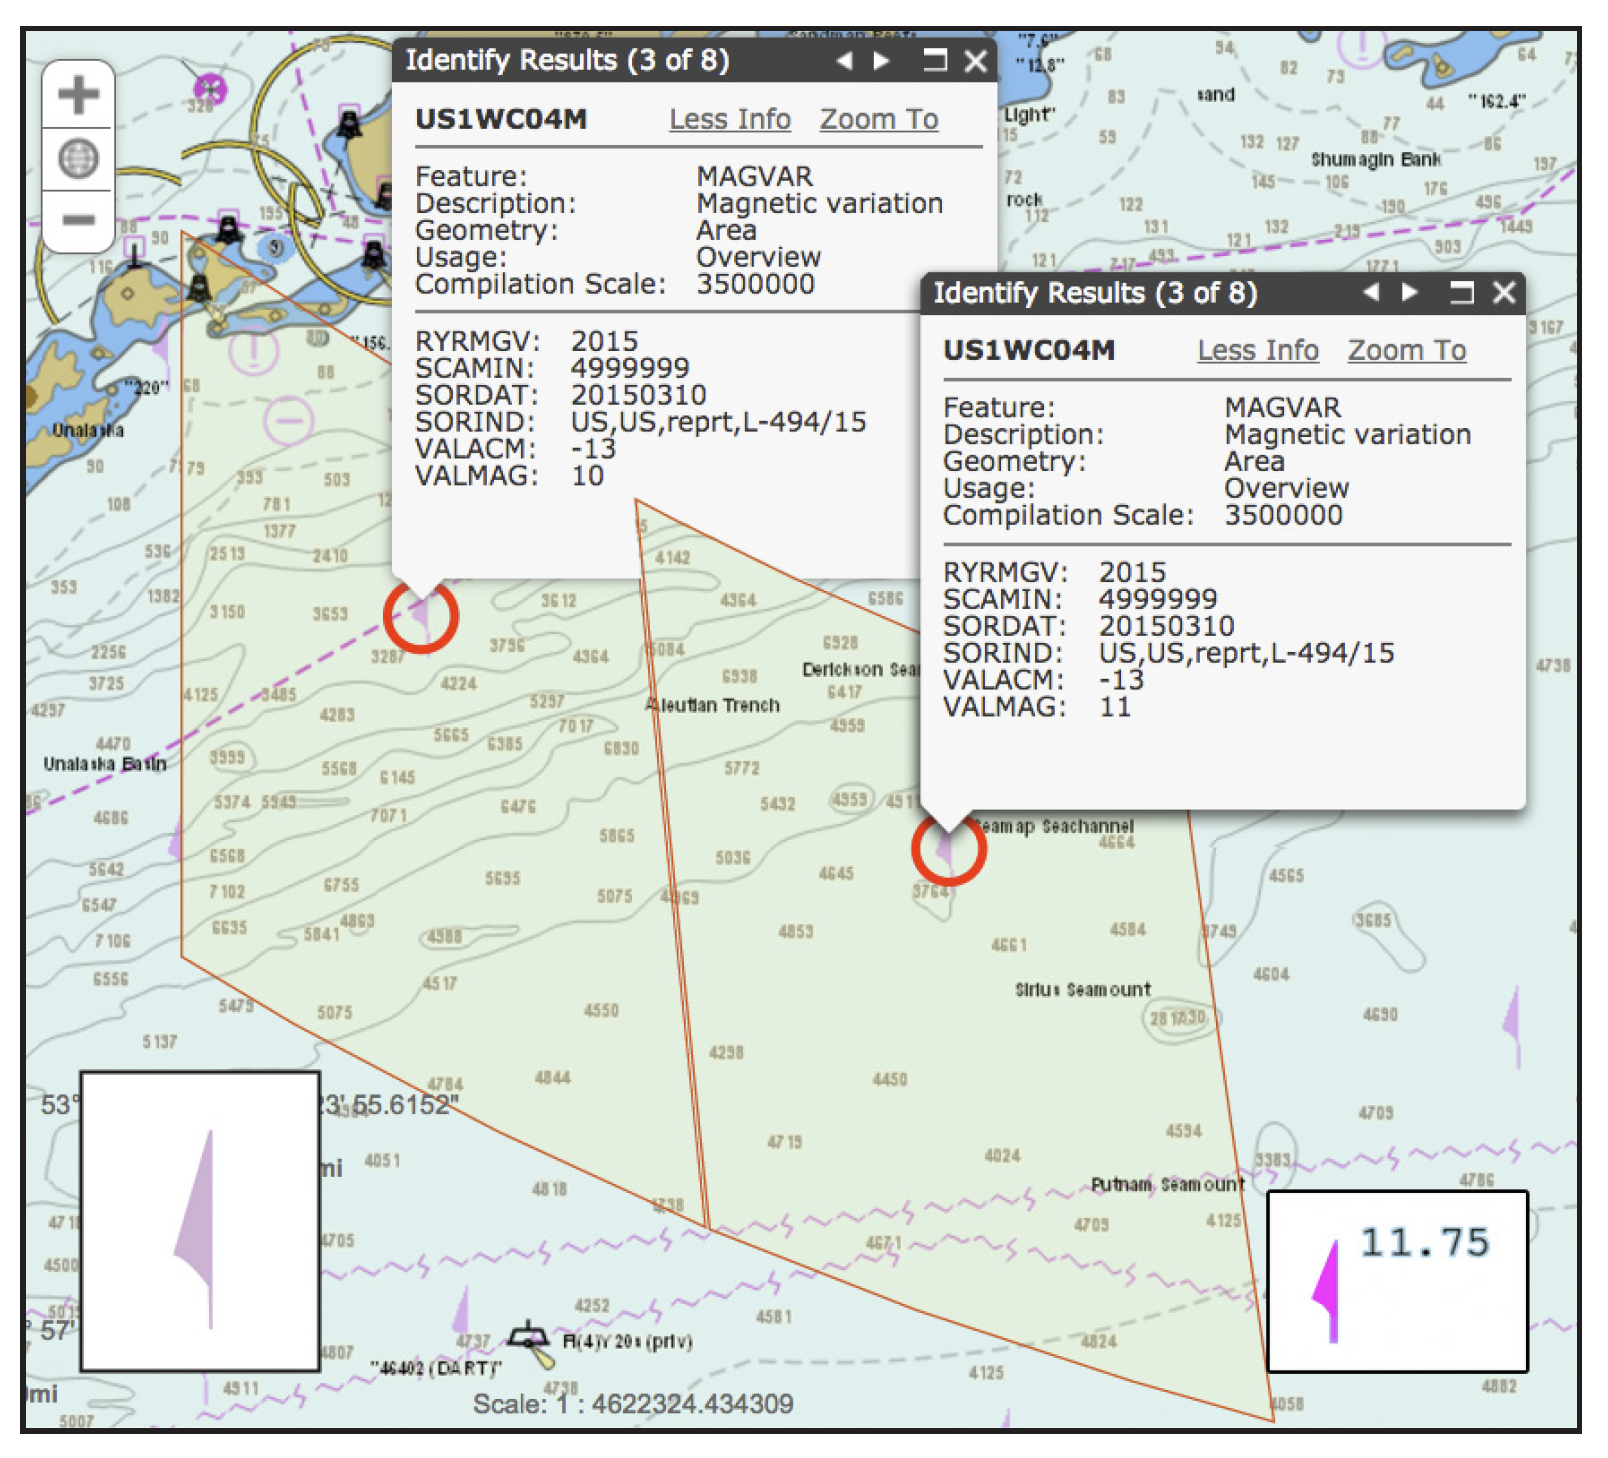
Figure 2.13-1. Another example of the value of the NOAA Online ENC viewer (Section 1.8), which has the instructive feature of outlining the boundaries of line and area objects when selected. Thus we can see the extents of MAGVAR area objects. We have made a composite of the reports to illustrate this pattern. In actual use, only one report at a time can be viewed. The MAGVAR areas can have other shapes, and the symbol changes locations as you view the area in different perspectives (called a “centered” symbol) The left-side inset shows the area object MAGVAR symbol; the right-side inset is a point MAGVAR object, showing just the value at that specific point. A hollow version of either symbol marks magnetic anomalies. The acronyms used in the pick report are explained in Figure 2.13-2. The scale minimum attribute of MAGVAR is typically the same as the soundings, so don’t expect the MAGVAR object to show up in a report if soundings are not showing. This image is from 2016.
There are symbols for magnetic variation seen periodically on the chart, although, as noted, we do not need to click it specifically to get variation. The symbols mark the identifying locations of the various MAGVAR area objects. These are the areas over which the variation is the same within one degree. These symbols are sparse in regions where the variation is not changing by one degree over the geographic span of the ENC cell. There is no correlation between the location of these MAGVAR symbols on an ENC and the placement of compass roses on the corresponding paper charts. On any ENC where we see a lot of these symbols it means the variation is changing by about 1º between the symbols.
A sample cursor pick report for a MAGVAR area object is shown in Figure 2.13-2. This is in principle the same data we get from a compass rose on a paper chart—if the paper charts were being kept up to date in this regard, but they are not. Often we do not need the value any more precisely, and since we are unlikely to be using old ENCs (as opposed to sometimes using old paper charts) it would be rare we needed to correct for the annual change in ENC values.

Figure 2.13-2. Cursor pick report for object Magnetic variation (MAGVAR) at a point. Point symbols include a text label showing the Value of the variation (VALMAG) to the hundredth of a degree at that specific point (15.83º E) and the Reference year (RYRMGV). The actual point report (top) includes values to the tenth of both variation (positive values are east) and its attribute Value of annual change in magnetic variation (VALACM), which is always in arc minutes, with an annual change toward the east being positive, and toward the west negative.
The bottom part of the report is for the area value of the variation at that location, which will always be rounded to the nearest whole degree that is the average value for the local area. You would get this same area report by cursor picking any place near this point on the chart.
Also shown is a MAGVAR area symbol, which is larger, in a fainter magenta, with no label. These symbols mark the area where the variation is constant to within 1º. These are elusive symbols (called “centered”), because they move on the chart as you change the display, staying as near the center of your screen as possible. They are identifying an area on the chart, not a point. Some ECS choose not to include these MAGVAR area symbols, as we can always get the variation with a cursor pick on the chart that reports the variation in that area. The only value of the symbol is to mark where the average variation is changing by 1º. More symbols (as seen farther north) indicate more change in the variation. Note that it can happen that an area average (15º in this case) is not the same as a point value in that area rounded to the nearest degree (15.8º in this case).
Also shown for comparison is the symbol for a point report of a magnetic variation anomaly. An area of anomaly symbol is the same as the area symbol shown, but in outline only (see Chapter 4, Section B).
The exception comes when doing a compass calibration, in which case we want this as accurate as possible. On paper charts, variation is marked East or West and the change is marked "Increasing" or "Decreasing," but on electronic navigational charts (ENC) only algebraic signs are used. East is + and West is –. Thus when the variation and the change have the same sign, the value is increasing with time; when they are opposite, the variation is decreasing. A value with no sign is +.
The correction is done in the normal manner. Using the value of annual change from Figure 2.13-2, in 2024, which is 3 years after the reference year, the correction would be 3 x -6’ = -18’ = -0.3º. The variation is 15º E, correcting to the west, so the corrected value is 15º - 0.3º = 14.7º E in 2024. We do not use the high precision point value for this because that is the value at just that one point, which is unlikely to be where we are at the time. If the correction and the variation are in the same direction, then it is getting bigger with time.
A main takeaway here is that even though the charts are updated weekly and the computer knows the time and date, we must still treat magnetic variation obtained from an ENC as if we were reading it from a paper chart. With that said, we note that this data is typically no more than a year old in ENC, so it is rare that we would need this correction.
Direct computation of magnetic variation
One reason some hydrographic offices might decide they do not need to encode the magnetic variation is because many ECS programs (and presumably some ECDIS as well) have incorporated special software that can compute the magnetic variation accurately for any location and date. One example of such a program is geomag.exe from the National Centers for Environmental Information (NCEI). This program can be downloaded for personal use, even if not used as part of an ECS. See References.
With this, or a similar program, running in the background, a user can interrogate any location on the chart to obtain the magnetic variation—even without an ENC loaded for that location. What information you get from that and how you execute the request depends on the specific ECS that has this feature. It could simply report the variation in plain language or present something similar to an ENC pick report. When using this supplemental ECS feature to find variation for a specific date and place, it would be good practice to check that it agrees with the value given in the ENC for the location.
These details of magnetic variation are important because ship captains are trained to make compass corrections accurate to a few tenths of a degree, which requires correspondingly accurate data. Accurate (point values) of the variation can be found at ngdc.noaa.gov/geomag/WMM. The World Magnetic Model (WMM) used for this is updated every five years. This program provides the variation values shown on ENC, so they should always agree.
Compass navigation is another advantage of ENC over traditional paper charts still in place that are in the process of being discontinued. Most paper charts do not have the latest MAGVAR data, some based on 2010 WMM data or even earlier models.
___
5 comments:
I have a question regarding progression of deviation. Is an increase always further from true north? Or is an increase always further east?
For example -
If the annual increase is 5 minutes, and the deviation is 5 degrees east, then after 2 years, the deviation is 5 degrees 10 minutes. BUT if the increase is 5 minutes & the deviation is 5 degrees WEST, then after 2 years, is the deviation 5 degrees 10 minutes or 4 degrees 50 minutes?
On charts that mark the progression E or W, it is clear to me which way things go. On charts that mark the progression increase or decrease, it is not clear to me because I do not understand if the increase is always east or if it is always further from true north.
First a clarification. I believe you are referring to variation and how it changes. We do not cover deviation here, and indeed there is no way to make predictions on how deviation changes. (What can further confuse this is, on land variation is called declination, adding a third word!)
A variation of 14º 20’ E marked on a 2023 chart as having annual decrease 9’ means that the variation will be 14º 11’ E in 2024. This would be true for E or W labels. Increase or decrease refers to the numerical value, not the label.
In short, it is simpler than we might guess knowing we add east and subtract west to make the corrections.
My apologies for my incorrect terminology, and my thanks to you for the corrections.
I believe that you are saying that an increase is always a move east & a decrease is always a move west. Just to confirm that I understand you correctly, If the variation was marked as 14º 20’ West, rather than East, and the decrease was marked the same 9’, then the following year the variation would be 14º 29’. This is because a decrease is always a move to the west & not always a move closer to a zero variation. Is that correct?
If i understand the question, the answer is No. The change applies to the direction of the existing variation, not always in a specific direction. Var W increasing is getting more west; Var W decreasing is getting less W. In your example, 14 20 W with annual decrease 9' would be 14 11 w the next year.
Thank You. That clears it up for me.
Post a Comment