What may not be so well known is this folder also includes weather maps for the Central Pacific that extend all the way to Australia. Below is a sample map followed by the file names for these maps. How to access them is discussed below that.

WIND/WAVE CHARTS - CENTRAL PACIFIC NAME
00Z Pacific Wind/Wave Analysis 30S-30N, 110W-130E PJFB89.TIF
12Z Pacific Wind/Wave Analysis 30S-30N, 110W-130E PJFD89.TIF
Pacific Wind/Wave Analysis (Most Current) PJFB10.TIF
24HR Pacific Wind/Wave Forecast VT00Z 30S-30N, 110W-130E PWFE82.TIF
24HR Pacific Wind/Wave Forecast VT12Z 30S-30N, 110W-130E PWFE84.TIF
24HR Pacific Wind/Wave Forecast (Most Current) PWFE11.TIF
48HR Pacific Wind/Wave Forecast VT00Z 30S-30N, 110W-130E PJFI89.TIF
48HR Pacific Wind/Wave Forecast VT12Z 30S-30N, 110W-130E PJFI91.TIF
48HR Pacific Wind/Wave Forecast (Most Current) PJFI10.TIF
72HR Pacific Sea State Forecast VT00Z 30S-30N, 110W-130E PJFK89.TIF
72HR Pacific Sea State Forecast VT12Z 30S-30N, 110W-130E PJFK91.TIF
72HR Pacific Sea State Forecast (Most Current) PJFK10.TIF
SURFACE CHARTS - CENTRAL PACIFIC
00Z Pacific Surface Analysis EQ-50N, 110W-130E PPBA88.TIF
06Z Pacific Surface Analysis EQ-50N, 110W-130E PPBA89.TIF
12Z Pacific Surface Analysis EQ-50N, 110W-130E PPBA90.TIF
18Z Pacific Surface Analysis EQ-50N, 110W-130E PPBA91.TIF
Pacific Surface Analysis (Most Current) PPBA11.TIF
00Z Pacific Streamline Analysis 30S-30N, 110W-130E PWFA90.TIF
06Z Pacific Streamline Analysis 30S-30N, 110W-130E PWFA91.TIF
12Z Pacific Streamline Analysis 30S-30N, 110W-130E PWFA92.TIF
18Z Pacific Streamline Analysis 30S-30N, 110W-130E PWFA93.TIF
Pacific Streamline Analysis (Most Current) PWFA11.TIF
03Z Significant Cloud Features 30S-50N, 110W-160E PBFA99.TIF
15Z Significant Cloud Features 30S-50N, 110W-160E PBFC99.TIF
Significant Cloud Features (Most Current) PBFA11.TIF
24HR Pacific Surface Forecast VT00Z 30S-50N 110W-130E PYFE87.TIF
24HR Pacific Surface Forecast VT12Z 30S-50N 110W-130E PYFE88.TIF
24HR Pacific Surface Forecast (Most Current) PYFE11.TIF
48HR Pacific Surface Forecast VT00Z 30S-50N 110W-130E PYFI87.TIF
48HR Pacific Surface Forecast VT12Z 30S-50N 110W-130E PYFI88.TIF
48HR Pacific Surface Forecast (Most Current) PYFI11.TIF
72HR Pacific Surface Forecast VT00Z 30S-50N 110W-130E PYFK87.TIF
72HR Pacific Surface Forecast VT12Z 30S-50N 110W-130E PYFK88.TIF
72HR Pacific Surface Forecast (Most Current) PYFK11.TIF
Note that there is no surface analysis offered for below the equator, just above it, but there is a 24h, 48h, and 72h forecast, plus an interesting streamline map.
There are several ways to obtain these maps.
(1) Direct internet link: https://tgftp.nws.noaa.gov/fax/PYFE11.TIF
(2) Use NWS FTPmail. That means sending an email to NWS.FTPMail.OPS@noaa.gov with the following lines of text, where you replace the file name with ones you want. You can ask for one or more.
open
cd fax
get PYFE11.TIF
get PYFI11.TIF
quit
send PYFE11.TIF
send PYFI11.TIF
Again, you can ask for one or more as shown.
Saildocs offers a special service on these in that they will automatically reduce the file size by 50% to save wireless transmission times. These reduced files are still perfectly legible. FTPmail sends them in their native size, 31 kb in this case; saildocs will send that one at about 15 kb.
If you want the full size image from saildocs, then send a request for the URL, namely send https://tgftp.nws.noaa.gov/fax/PYFE11.TIF
==== BOM Maps ====
We can also request the maps from the Australian Bureau of Meteorology. Below is a sample and then a list of the maps available. We get these from saildocs as explained below.

These charts are available in the following form:
http://www.bom.gov.au/difacs/IDX0854.gif
These are the maps they broadcast by radio fax; the times on the left are the broadcast times; file names are made up from the IDcode on the right by adding .gif


Time (UTC) Description of Item and Current Chart                       IDcode
0015-0030 VMC/VMW Schedule Page 1 of 2                                IDX0468
0030-0045 VMC/VMW Schedule Page 2 of 2                                IDX0469
0045-0100 VMC/VMW Information Notice                                  IDX0467
0100-0130 IPS Recommended Frequencies for VMC (Charleville            IDX0470
0130-0200 IPS Recommended Frequencies for VMW (Wiluna)             IDX0473
0200-0215 Australian MSLP Prog (H+36) Valid 0000                      IDX0104
0245-0300 Australian MSLP Anal (Manual) Valid 0000                    IDX0102
0300-0315 Australian 500 hPa Anal Valid 0000                          IDX0099
0315-0330 Voice Broadcast Information for VMC and VMW                 IDX0461
0400-0415 Australian 500 hPa (H+24) Prog Valid 0000                   IDX0090
0430-0445 Australian MSLP 4-day forecast, Days 1 and 2                IDX0041
0445-0500 Australian MSLP 4-day forecast, Days 3 and 4                IDX0042
0600-0622 Asian (Part A) Gradient Level Wind Anal (Manual) Valid 0000 IDX0965
0623-0645 Asian (Part B) Gradient Level Wind Anal (Manual) Valid 0000 IDX0966
0645-0700 Asian MSLP Anal (Manual) Valid 0000                         IDX0016
0730-0745 Indian Ocean MSLP Anal (Manual) Valid 0000                  IDX0033
0745-0800 Australian Wind Waves Ht(m) Prog Valid 0000 (H+24)          IDX0049
0800-0815 Australian Swell Waves Ht(m) Prog (H+24) Valid 0000         IDX0050
0830-0845 South Pacific Ocean MSLP Anal Valid 0000                    IDX0032
0845-0900 Australian MSLP Anal (Manual) Valid 0600                    IDX0354
0900-0915 Australian MSLP Prog (H+36) Valid 0000                      IDX0104
0915-0930 Australian MSLP 4-day forecast, Days 1 and 2                IDX0041
0930-0945 Australian MSLP 4-day forecast, Days 3 and 4                IDX0042
1015-1030 Casey Eastern and Western High Seas (H+24) valid 0000       IDX1087
1030-1045 S.H. 500 hPa Prog (H+48) Valid 0000                         IDX0004
1045-1100 S.H. MSLP Prog (H+48) Valid 0000                            IDX0003
1100-1115 Casey Eastern and Western High Seas (H+36) valid 0000       IDX1088
1115-1130 S.H. 500 hPa Anal Valid 0000                                IDX0008
1130-1145 Asian Sea Surface Temp Anal (Weekly)                        IDX0084
1145-1200 VMC/VMW Information Notice                                  IDX0467
1200-1215 Australian MSLP Prog (H+36) Valid 1200                      IDX0011
1215-1230 VMC/VMW Schedule Page 1 of 2                                IDX0468
1230-1245 VMC/VMW Schedule Page 2 of 2                                IDX0469
1245-1300 Indian Ocean MSLP Prog (H+36) Valid 1200                    IDX0002
1315-1330 South Pacific Ocean Total Waves (H+48) Valid 0000           IDX0949
1330-1345 Indian Ocean Total Waves (H+48) Valid 0000                  IDX0948
1345-1400 Pacific Ocean Sea Surface Temps (Weekly)                    IDX0942
1400-1415 Indian Ocean Sea Surface Temps (Weekly)                     IDX0946
1415-1430 Casey Eastern and Western High Seas (H+48) valid 0000       IDX1089
1430-1445 Australian MSLP Anal (Manual) Valid 1200                    IDX0602
1500-1515 Australian 500 hPa Anal Valid 1200                          IDX0099
1515-1530 Australian MSLP Prog (H+36) Valid 1200                      IDX0604
1600-1615 Australian 500 hPa Prog (H+24) Valid 1200                   IDX0090
1630-1700 IPS Recommended Frequencies for VMC (Charleville)           IDX0470
1700-1730 IPS Recommended Frequencies for VMW (Wiluna)                IDX0473
1800-1822 Asian (Part A) Gradient Level Wind Anal (Manual) Valid 1200 IDX0967
1823-1845 Asian (Part B) Gradient Level Wind Anal (Manual) Valid 1200 IDX0968
1915-1930 Indian Ocean MSLP Anal (Manual) Valid 1200                  IDX0533
1930-1945 Australian Wind Waves Ht(m) Prog (H+24) Valid 1200          IDX0049
1945-2000 Australian Swell Waves Ht(m) Prog (H+24) Valid 1200         IDX0050
2000-2015 South Pacific Ocean MSLP Anal (Manual) Valid 1200           IDX0532
2015-2030 Casey Eastern and Western High Seas (H+24) valid 1200       IDX1087
2030-2045 Australian MSLP Anal (Manual) Valid 1800                    IDX0854
2215-2230 Casey Eastern and Western High Seas (H+36) valid 1200       IDX1088
2230-2245 S.H. 500 hPa Prog (H+48) Valid 1200                         IDX0004
2245-2300 S.H. MSLP Prog (H+48) Valid 1200                            IDX0003
2300-2315 S.H. 500 hPa Anal Valid 1200                                IDX0008
2315-2330 Casey Eastern and Western High Seas (H+48) valid 1200       IDX1089
2330-2345 Australian MSLP Prog (H+36) Valid 0000                      IDX0011
2345-0000 Indian Ocean MSLP Prog (H+48) Valid 1200                    IDX0006
send http://www.bom.gov.au/difacs/IDX0854.gif and replace the file name with the ones desired. One line for each map.
==== South America Surface Analysis ====
The Brazilian Navy offers a great analysis map at 00z and 12z. A sample is below, followed by instructions for getting it underway. This map is a good test for model forecasts and includes several unique pieces of information as we explain in our textbook Modern Marine Weather, 3rd ed.

You can view this map online at https://www.marinha.mil.br/chm/dados-do-smm-cartas-sinoticas/cartas-sinoticas, keeping in mind that it is sometimes a slow link to respond.
To obtain the map from saildocs, send this form of request:
send https://www.marinha.mil.br/chm/sites/www.marinha.mil.br.chm/files/cartas-sinoticas/c19011600.jpg
where the filename is CYYMMDDhh.jpg and hh is either 00 or 12.
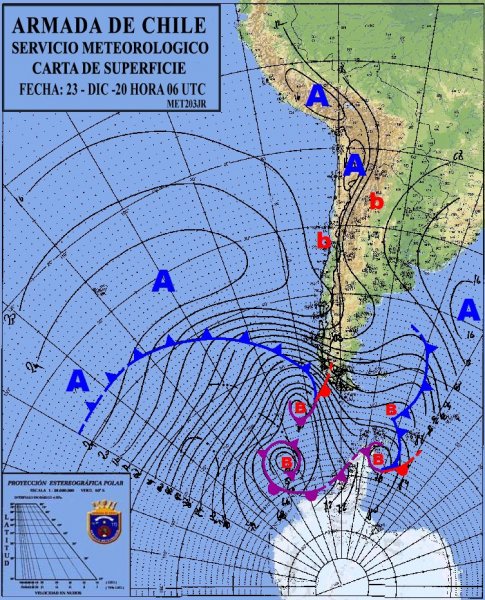
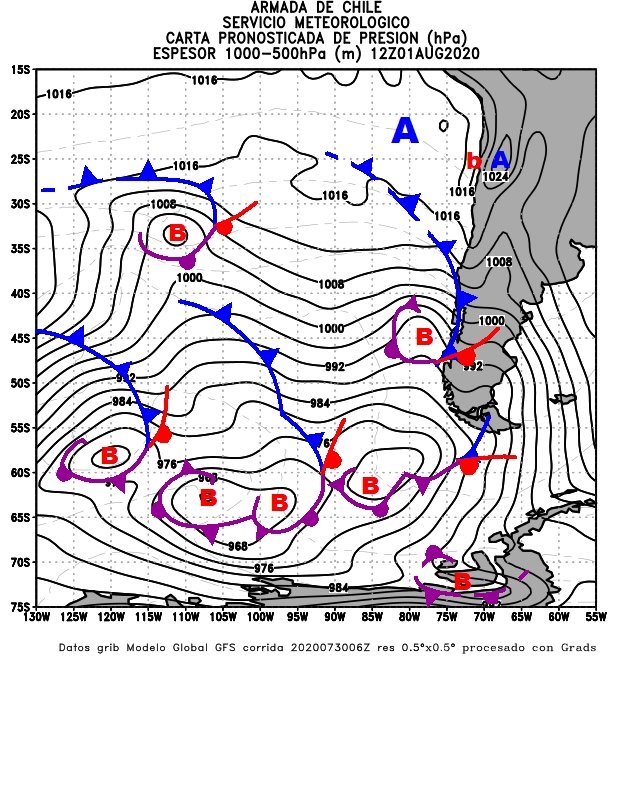
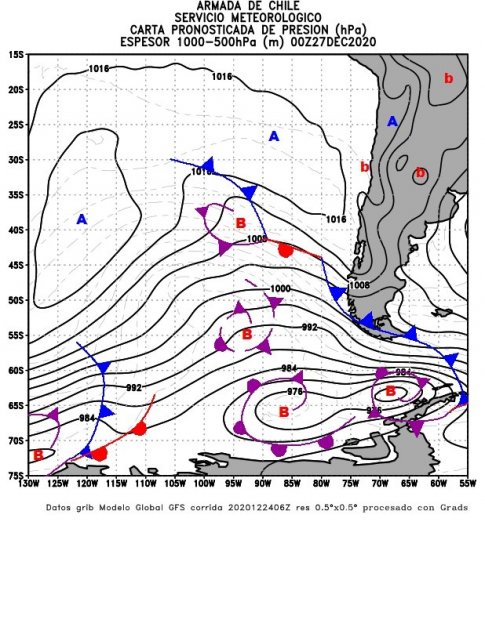
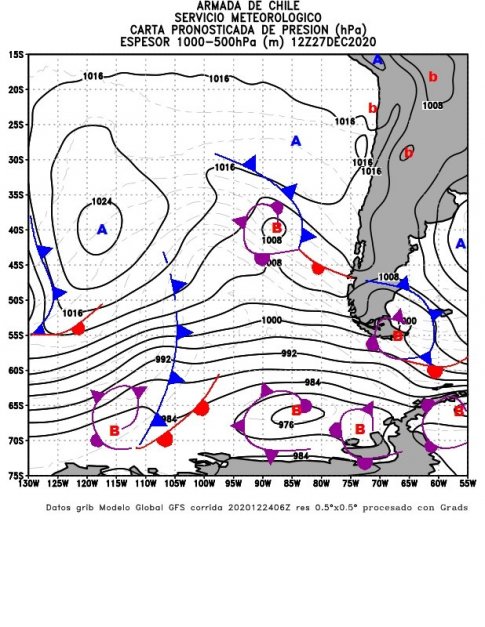
There are other maps available from JMA, FiJi Met Office, Chilean Met Service, and the South African Weather Service. Samples are below.
JMA

Analysis 00z
Analysis 06z
Analysis 12z
Analysis 18z
Forecast 24h, 00z
Forecast 24h, 12z
Forecast 48h, 00z
Forecast 48h, 12z


Analysis
http://meteoarmada.directemar.cl/prontus_meteo/site/artic/20151128/imag/FOTO_0120151128141737.jpgForecast 12h
http://meteoarmada.directemar.cl/prontus_meteo/site/artic/20140101/imag/FOTO_MIX_RESULT20140101174630.jpg
Forecast 24h
http://meteoarmada.directemar.cl/prontus_meteo/site/artic/20160504/imag/FOTO_0120160504060506.jpg
Forecast 36h
http://meteoarmada.directemar.cl/prontus_meteo/site/artic/20140101/imag/FOTO_0520140101174727.jpg
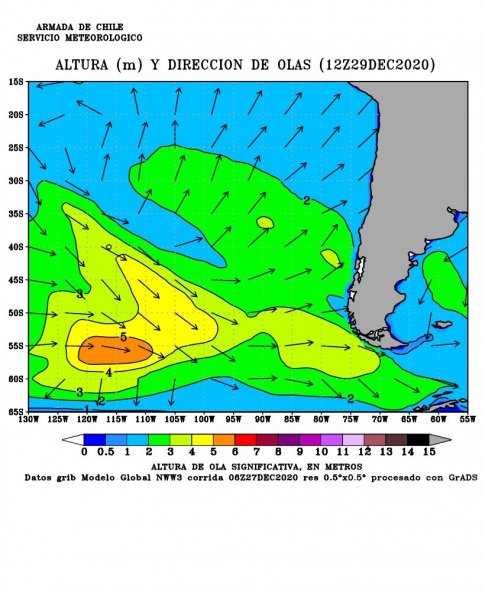
Significant Wave
http://meteoarmada.directemar.cl/prontus_meteo/site/artic/20140105/imag/FOTO_0720140105094103.jpg
See also this excellent link from Chilean Navy Weather, which includes a hi-res surface analysis (BW synoptic). This site includes graphic output of a locally run WRF model for coastal winds.

No comments:
Post a Comment