Prior to 2021, NOAA's Center for Operational Oceanographic Products and Services (CO-OPS) supported the publication of their tide and current predictions in these six books, which we can still find in full online.
Tide Tables
2020 East Coast of North and South America Including Greenland
2020 Europe and West Coast of Africa Including the Mediterranean Sea
2020 Central and Western Pacific Ocean and Indian Ocean
2020 West Coast of North and South America Including the Hawaiian Islands
Tidal Current Tables
2020 Atlantic Coast of North America
2020 Pacific Coast of North America and Asia.
Prior to 2021, these were "the official sources." All other third-party printed or electronic presentations of US tide and current data, readily found along the waterways and cybersphere, were derived from these, sometimes mixing up actual locations or confusing standard times and daylight times.
Because of the potential errors in third-party reproductions, responsible navigation schools always relied upon these primary official sources and taught how to use them. The USCG does the same; all deck license candidates must learn to use these tables, and they are included on the license exams.
Each of these six books listed above (both Tides and Currents) present in a Table 1 the daily predictions at several dozen reference stations distributed along the area covered, and then in a separate Table 2 they list the corrections needed for the hundreds of subordinate stations included.
To find the values at a subordinate station, we would learn from Table 2 what reference station applies, look up the tides or currents for the time range of interest at that reference station, and then we would apply to those values the corrections we get from Table 2 for the subordinate station we care about. For tides, we correct both high and low water times and heights. For the currents, we correct for the times of peak flow and slack, and we correct the speeds and directions of both the flood and ebb.
The process is readily carried out once learned, but the use of Tables 2, covered on every final exam, has been the bane of quite a few students—some corrections are additive; some are multiplicative; in the time column "min." means minimum, not minutes; the time zone is given in code; corrections can depend on the sequence; and so on.
But let me stop here to get to the good news before getting to implications of this news.
The good news
As of 2021, NOAA has done away with Table 2 completely, for both tides and currents. Indeed, they have done away with supporting the production of any book or PDF file that contains more than one station, so there is no need for a table of subordinate station corrections. We can all now just take a slow, deep, zazen breath, and let all of those long hours of hard work on Tables 2 gently slip out of our existence and into space.
Those new to navigation from now on do not have to learn these tables at all. If Table 2 comes up in class, you could raise your hand and say, "Those tables don't exist; why are we still covering this?"
Tide-and-current-wise, we move into a new era, although we have in fact been in this era for over six months now as I write this.
In a sense, this change should not be a surprise. Here is the Announcement that appeared in all of the 2020 tide and current tables (the six cited above), as well as various Local Notices to Mariners:
In another sense, however, which might account for why I believe very few navigators and even navigation instructors are not aware of this yet, is even seeing the Announcement we might not get the full implication of what is being said.
Navigation instructors know, for example, that NOAA has not actually printed any tide or current books since 1995. We have for years thought of these as commercial books available from several competing publishers. We have just assumed—or read on the covers—that these publishers got the data from NOAA, and that they were somehow vetted to provide quality products.
What the announcement means by "ending the production of the printed tables" is starting in 2021, NOAA is no longer providing these commercial companies with a PDF file of the book content, plus, even more important, they are ending support and updates of the famous Tables 2, both tide and current. The implication is that the six books listed above will no longer be available from any publisher starting in 2021.
One snag to getting this important message across is, for example, I have sitting on my desk at the moment brand new copies of the 2021 versions of two of those no-longer-existing books!— or at least it looks like the same books, one for tides, one for currents. The format and covers are identical to last years, and at first glance the titles are the same, but now that I know to look carefully, I see that the titles are not identical. The 2021 versions refer only to North America, with no reference to other continents. Looking inside, we see on page 1 that this is the "Commercial edition," no reference to being an official publication.
This publisher has gone to a lot of extra work to meet the needs of many mariners by creating a custom edition, which offers a stop-gap solution during this transition. But it would not be difficult for a consumer to overlook the subtle differences in the book titles, especially since the vast majority of mariners who historically thought they were required to have this book never used the international data.
Another snag to being aware that things have changed come from our interaction with the latest 2021 electronic navigational chart. If I do a cursor pick on any of the tidal stream objects (TS_FEB) on the latest 2021 electronic navigational chart (ENC)—these charts are updated weekly—I get back a report of two attributes for average speed (CURVEL) and average direction (ORIENT) which present data direct from Table 2. But more to the point, each tidal stream report (in West Coast waters) tells us to get details from a book called Tidal Current Tables, Pacific Coast of North America, which we would have to assume exists. This statement will likely change to get details from www.tidesandcurrents.noaa.gov. Some navigation programs could present it as a live link.
The ENC chart makers at NOAA are aware of this now, and they are quick on their feet with weekly updates. This will likely be fixed in a couple weeks.
And still another reason that responsible navigators might not be aware of this big change is the recent update to Bowditch's American Practical Navigator, NGA Pub. No. 9—the bible of American navigation. The 2019 edition was just updated this week, called the June, 2021 edition. This venerable publication seems to have also missed the Announcement or misinterpreted it. They cover Table 2 in this update just as they have for decades. Now, in fact, they could save about 4 full pages of the 764 pages of Volume 1 by removing the coverage of Table 2—or by moving it to the history of navigation section.
Despite these snags to being alerted to the change (which will soon be resolved) there are perfectly logical reasons for this inevitable decision from NOAA, and they outline these in the Announcement.
Reason (a) the USCG now allows digital copies of tide and current data to meet carriage requirements.
It is not given in the announcement, but the official USCG ruling on carriage requirements was dated May 21, 2020, which refers to "publications required by 33 CFR 164," among others, that are now allowed to be digital, shown below—with emphasis that they are only needed for the "area being transited," which means mariners do not need all of the stations that were in the old books.
The official USCG wording of the change is in their document: USCG Navigation and Vessel Inspection Circular (
NVIC 01-16 CH-2).
The timing of the carriage requirements change (May, 2020) brings to mind something else. This came right at the onset of the COVID pandemic. It was not the worst point, which was yet to come, but when this significant ruling came into law, nine populous states had been in full lockdown for two months. Navigation schools and all maritime training facilities were closed, their instructors off doing something else. These schools have just opened up in the past months. In short, I see quite a few ways to understand how this could go unnoticed. Reason (b) from the Announcement is the existence of "online sources," their own of course being the primary one, and "electronic services" that provide the tide and current data. That latter (rather pregnant) term presumably means apps that use the official NOAA harmonics (or, more likely, a verified version of them) to compute the data for any time or station.
In other words, from now on, we are going to have to get tide and current data like we actually get the data already... or at least like we get it most of the time: we use the tide or current icon in our navigation program or an app in our phone. For crucial inland transits, ships can in some waterways even access high accuracy real-time measured water levels online.
But it is not all good news...
No more international data from NOAA
What is not mentioned in the announcement is NOAA is no longer providing in any format tide and current data from other nations. A check of the Tables of Contents of the six books listed above shows that NOAA did indeed for years provide fairly thorough tide height coverage across the globe as well as notable tidal current data.
That has all been discontinued, but for a different reason, essentially coincidental in timing. As I understand it, in the past, NOS/NOAA has had agreements with various nations to reproduce tide and current data from their hydrographic offices together with our own in a book-only format that would be helpful to their mariners as well as ours. That went on for many years, but in each case the other nations were providing NOAA only the annual values of times and heights of highs and lows, plus peak times and speeds for currents. They did not share the harmonic constants that they used to compute the data. NOAA could publish the annual data as given to them, but could not compute it.
Over the years, several of the key suppliers of that data have since changed their policies on this and now treat their harmonics as proprietary intellectual property, and have set up commercial enterprises to sell their hydrographic (and meteorological) data as a way to help support their agencies. Some agencies, notably the UKHO/BA have made further arrangements with these other nations, so they now broker the sales of this data for multiple nations.
The result is easy to explain. If we want official tide or current data from another nation, we have to buy it from that nation or one of its representatives. Any third party source would have to be carefully checked, as it would not be guaranteed. Ironically, these (mostly invariant) international harmonics were at one time public domain, but once withdrawn, they have been aggressively protected against public distribution.
Comparing the old and the new
The main impact of this transition in my mind is not about how we actually get the data underway—we have used these "modern" methods for over 20 years—but rather, the effect this has on teaching this important aspect of marine navigation. It is not entirely unlike the transition from traditional piloting to the reliance on GPS. We want to use the fastest, most accurate method, but once it turns into a black box, we have to devise ways to check it.
Wrong tides or wrong currents in some circumstances can lead to a major screw-up, and indeed one that would be hard to get forgiven. Especially the tides, since they are probably the best predicted environmental parameter on earth, and they are typically uniform over large areas. Currents, on the other hand, are honestly hard to predict, even with the best tools, once you get just a 100 yards or so from the reporting stations, but we at least have to start out with correct data at the stations.
We get insight into what is involved by taking a short last look at the Tables 2. Samples of Table 2 for currents on the West Coast relative to reference station San Juan Channel are shown below for the year 2020, then one two years earlier, and then one 10 years earlier.
The example we have been looking at in other studies is Wasp Passage, and even though we see that the stations have been renumbered we can track this one to note that the correction values do indeed change notably with time. It looks like they were constant for 8 or 9 years (or at least not updated) and then got updated in 2019. A check in the 2020 tables tells us that the San Juan Channel reference station was in fact updated in 2019. It looks like that implies the subordinate corrections get updated as well.
(Note we can see in the samples above the improvements in Table 2 current corrections. Prior to the update reflected in the 2020 Table 2 corrections, currents were treated as pure reversing currents, so the minimum speeds before flood or ebb were considered zero, or unknown (--). With better data, we learn that these currents are actually rotating, not just reversing. This means the track of current directions is not just back and forth along a line, but rather the direction follows the path of a narrow ellipse. The water is never still, but just at a minimum between cycles, which is now listed.)
Looking now at the Table 2 for tide corrections for 2020 and 2010 in about the same location using tidal reference station Port Townsend, we see a quite different result.
It appears that these corrections for the tides are not changing. But more important than not changing over 10 years, these old Table 2 tide corrections still get us the right times and heights of the tides in 2021—at least in the couple cases we have checked, one of which is shown below... which leads us in part to our new approach to tides and currents.
The left is the July 16, 2021 data from the reference station, then the Table 2 corrections are applied—you can think of them as from 2010 or 2020—to get the Orcas tides, and then we look at the correct values from CO-OPS, and then we look at one example of what the Announcement referred to as an "electronic service," namely the tide height function within the navigation program called qtVlm — you can also read these same values with the popular nav program called OpenCPN.
This specific navigation program provides the functionality to read and display tide and current data, but they do not provide any actual harmonic constants, specifically because of the copyright issues mentioned above. This is a French program, so it has many users without direct interest in the free harmonics for US waters. I then manually loaded a set of harmonics that are described as based on the latest US data and very specifically states that they do not contain any copyrighted data. The set cited in the figure includes both tides and currents. The format of the file (TCD) is called tide and current database.
(I might note in passing that most navigation apps produced in the US do, in contrast, arrive with harmonics already installed. Chances are these are the latest versions and that they get updated as needed, but it would still be a good exercise to compare a couple subordinate stations with the CO-OPS values.)
We see immediately two things: the Table 2 data for tides seems to have been constant and accurate over the past 10 years (again, we have done just a couple checks) and we see that the latest xtide presentation of the US harmonics are accurate for the two stations we checked. That is no guarantee at all that others are right. We have, in a sense, checked just two stations; in the end we have to check all stations we count on.
But the point here is, with this new CO-OPS approach to the data, we do not have to use Table 2 to check this. We would just go to their website and download the year's data for the actual stations we care about (reference stations or subordinate stations) and then email them to ourselves, and then open them in some ebook reader in our phones. Then we can easily spot check a few neaps and springs in a matter of minutes, anytime we care to. Again, in the end we want to use the apps in our nav program because they are so convenient. We just have to check them first.
The situation with the currents is different, which shows why we should be happy that Table 2 is gone. Below is a sample worked out for Table 2 solutions for currents:

We get the July 16, 2021 reference station data from CO-OPS on the left, apply the corrections from Table 2 (shown above) and get the Wasp Passage Table 2 predictions that way, using the last and most recent values from 2020. Then we look up what the Wasp Passage currents really were on this day from CO-OPS, and they do not agree. Off by about 0.5 kts in one case. The times are off up to 20 minutes, but that is essentially within the uncertainty we might expect, but speed errors are larger than we would expect. Had we used 2010 values the speeds would have been off a few tenths more. Likewise, if we had used 2021 values, which we do not know, then we would presumably have done better. In short, these current corrections in Table 2 are drifting, and since they are no longer being maintained and updated by NOAA, we cannot count on using them. The same is true with the tides. Even though we do not at the moment see effects on tide predictions, this might be related to update schedules. NOAA is telling us not to use them.
But again, that is all history. Looking at the new methods we must use, we see from the qtVlm agreement with CO-OPS that the harmonics used seem good. NOAA actually tells us the numerical value of the harmonics, 37 sets of 3 numbers for each station, but it is mathematically difficult to get into some formats of the harmonics files to check these digitally. For the most part, the checking must be done by looking at the end products.
Looking ahead, it seems we might be able to use new features of the NOAA website to download a full set of the latest US harmonics for tides and currents in one file. This could then be used in popular navigation programs, hopefully with a date label. We are looking into this.
Also to note, NOAA no longer uses the name reference stations. These are now called harmonic stations, although this terminology change is not yet reflected in their excellent online Tide and Current Glossary. The subordinate station name has not changed, and the meanings have not changed. They have harmonics for harmonic stations and calculate predictions directly using them, whereas subordinate station predictions are based on a nearby harmonic station by applying corrections. The big difference is they no longer publish those corrections; they just present the corrected data online.
What do we teach from now on?
• First we abandon both Table 2s as a means of finding tides or currents, and we remove any training materials we have on them, and we remove any quiz or exam questions that use them.
• We still have to teach standard tide and current table format. That has not changed, but now subordinate and reference stations are presented in the same manner. Instructors might be able to reword exercises that used subordinate stations to now use the reference station data that was already in their materials. Developing new exercises from scratch, we can now use a favored subordinate station showing daily data.
• Students will soon face the reality that going to the primary sources current data are available at several depths. Sometimes it will be obvious to take the one nearest the surface, but there are exceptions where there is a lot of very shallow current data, so we will have to look into an average.
• We encourage everyone to go to the historic tide data page and download a set of all six of the 2020 books. We want these for several reasons. Each book has extensive notes on tides and currents in general with several valuable related tables, although much of this auxiliary material will be redundant. It is also of interest to look at the footnotes to Table 2 stations you care about, even though we will not be using Table 2. The Explanations of the Tables 2 are also valuable information, even though we do not use the corrections.
• Also, as we show elsewhere and have briefly outlined above, we can use this historic data to test harmonics not just in US waters but over much of the globe. If the harmonics are good, they will be good for many years.
• Then we teach students how to access the online tide and current prediction pages at tidesandcurrents.noaa.gov. It is not quite as direct from the main page as we might hope since they are presenting users with a lot of other data on this page. Here are now the direct links to the "official data." Both links also include a national map of the station locations.
Tide Predictions by Station
Tidal Current Predictions
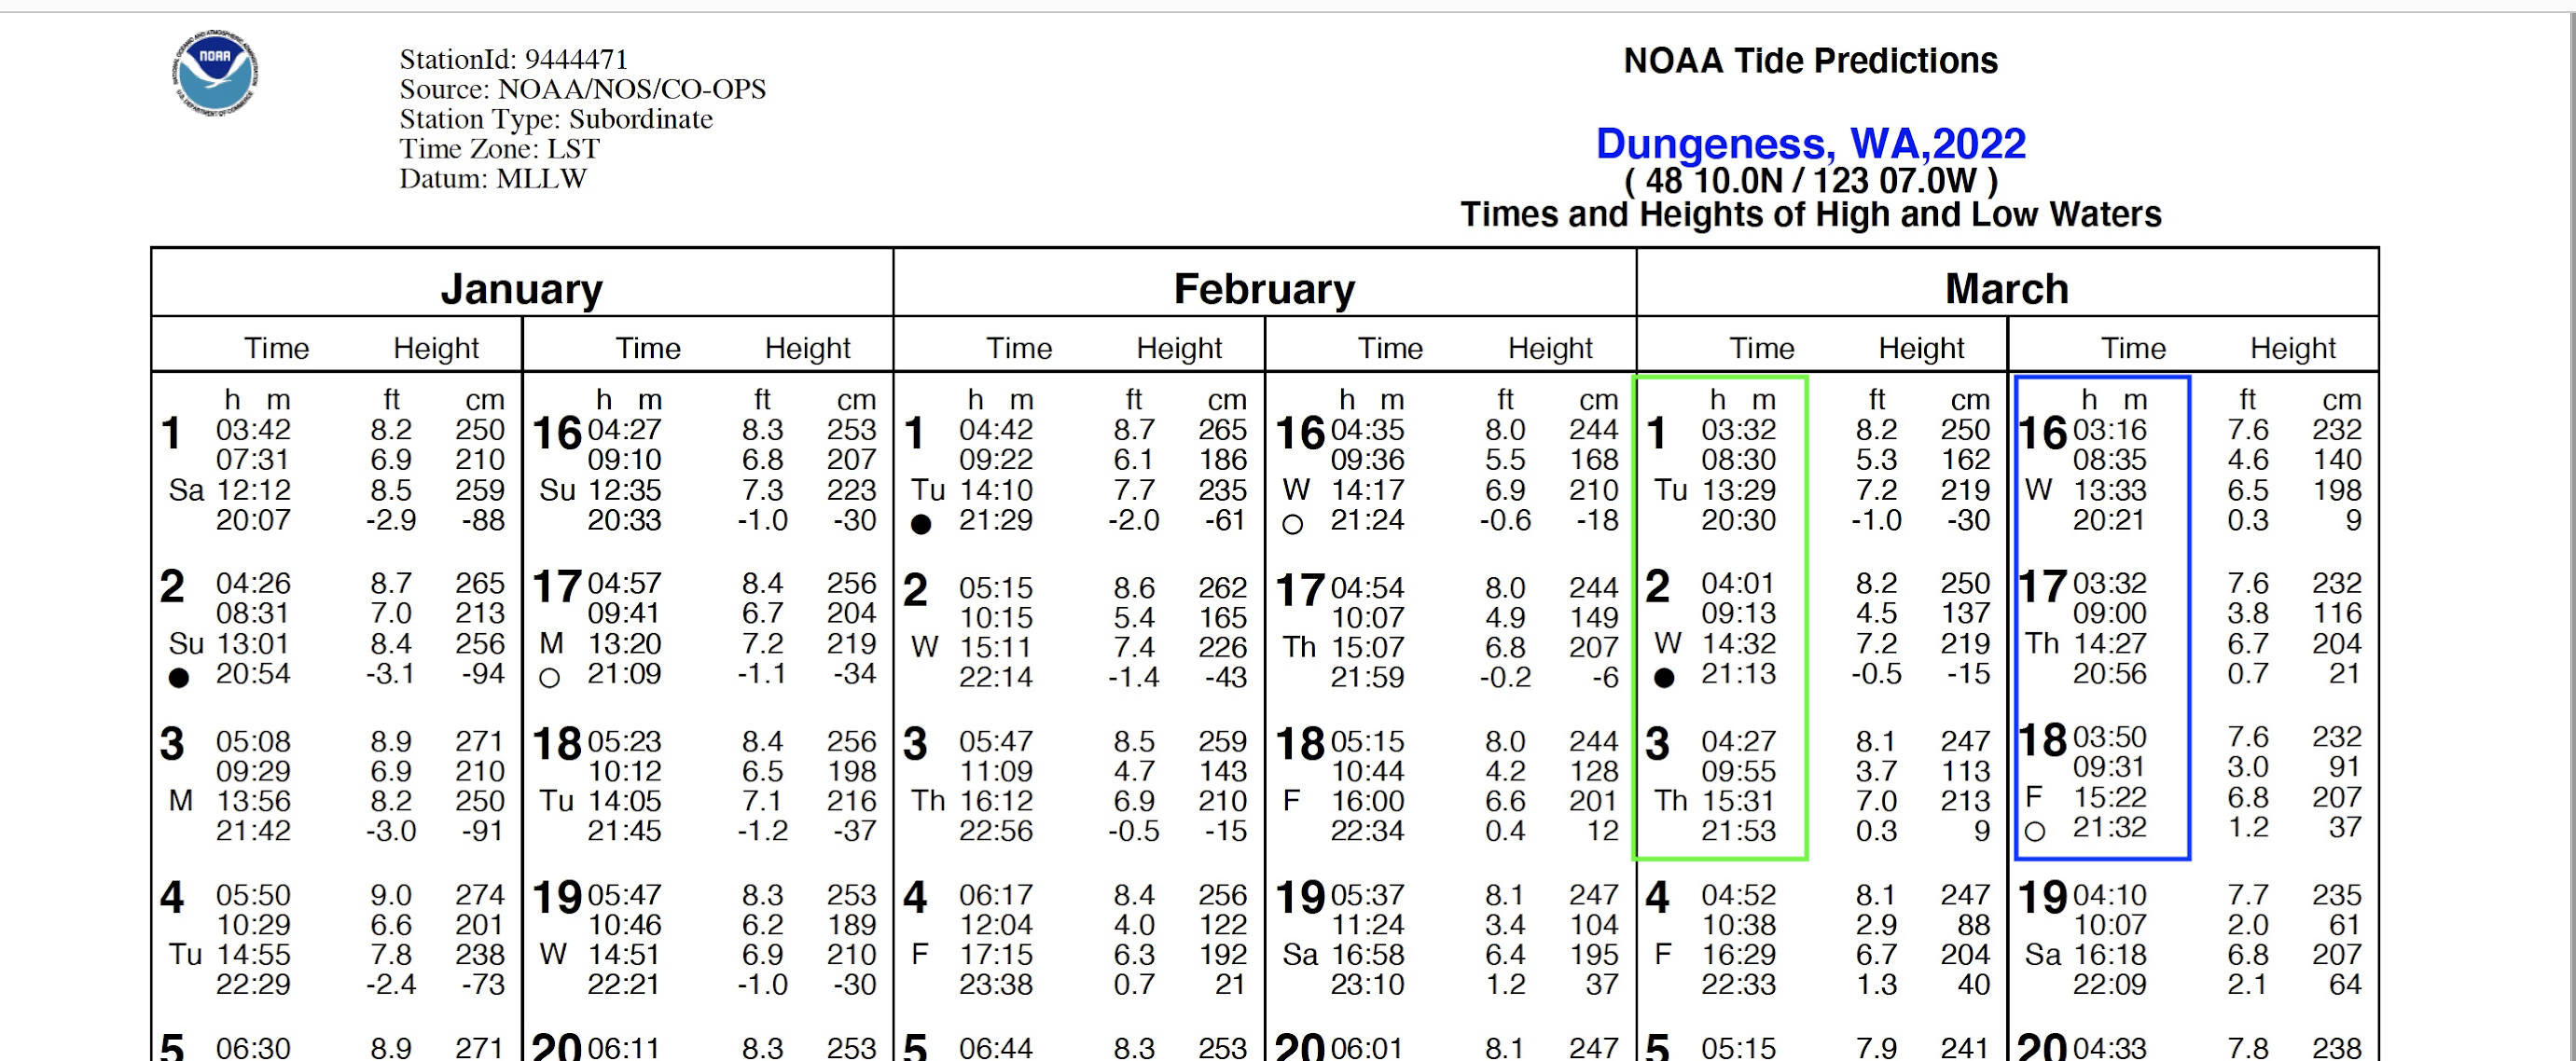
• Then we practice going to specific stations we care about and find how to make an annual PDF table of the data we want. This is fairly transparent, but coaching helps. Below is a sample page of a PDF file. See notes on the process in this follow up article.
• Next we might go over various ways to get this official info into a mobile device and the various ways to organize it, especially since we will now be using multiple individual stations. Most phones will open a PDF directly, but with multiple files, we are likely best storing them in an ebook reader library for easy organization and access. NOAA policy now is that to be considered official data it must have the logos on the tables.
Official NOAA current data in a phone, with zoomed view on the right.
• Then we must teach and demonstrate the importance of verifying any tide or current app they are using. It will likely be easy to show that an app in some student's pocket at the moment has outdated data in it. We will post follow up notes on this statement.
• And there are a couple minor things to point out as well and address as needed, i.e. they use decimal degrees to locate current stations, but degrees and minutes to locate tide stations.
• In short, the tides and currents predictions sections of our courses have to change.
For our own Starpath courses, we have added errata online that renders about five pages of our own textbook (Inland and Coastal Navigation) outdated; we are fixing this now. We have also removed all questions in our online course quizzes and exams that require use of Table 2 in tides or currents. I can imagine students in navigation courses around the country saying goodbye to Tables 2 with a party in the coffee room—unless they are preparing for a USCG exam. In that case, the path of least resistance takes you right back to the 1980s Tables 2 in your study materials. Eventually this news will float up to the top and the related questions removed, but this may take a while.
______
Essentially all of the information presented here is available in the old tide and current books discussed above or on the extensive tidesandcurrents.noaa.gov website. However, with that said, I want to add that over the years we have found that the customer support team at CO-OPS have been exceptional in providing prompt, detailed answers to any of our questions, and we remain grateful for that.
______
We also note that several companies are still in 2023 distributing the old 2020 Tables 2 without warning that they are outdated. We can check these links to records of updated tides and updated currents to help us anticipate which data in these old Tables 2 might be wrong.


