In a recent note we
compared the Air Almanac with the Nautical Almanac, and presented ways to obtain a copy of either. A unique feature of the
Air Almanac (AA) is its set of Sky Diagrams intended for planning the optimum sextant sights to take for the best fix. We are typically confronted with a sky full of stars and a planet or two, and the choices we make are crucial to optimum accuracy of the resulting fix.
Here we illustrate that selection process using the Sky Diagrams and compare it with two other methods of sight planning, Pub 249 Vol. 1 and the 2102-D Star Finder. Then for completeness, we jump into the electronic world and look at the Best Sights function of our StarPilot apps to confirm what the manual methods found.
For reference as we proceed, here is a set of the
2019 Sky Diagrams extracted from the 2019
Air Almanac, which includes the official Explanation of the diagrams. (We also have the latest annual set at our
cel nav book support page.)
The Sky Diagrams are radar-like plots of the heights and bearings of all celestial bodies in the sky that we might use for a sextant sight. There is a diagram for every 2 hours of LMT for the 15th of each month of the almanac year, for latitudes 50S, 25S, 00, 25N, 50N, and 75N. They are grouped into
Morning Sky (01, 03, 05, and 07, LMT),
Daytime Sky (09, 11, 13, 15), and
Evening Sky (17, 19, 21, 23). The Daytime Sky is mostly for planning sun-moon sights, but also useful in finding these bodies in a cloudy sky, without resorting to computations. Also, in some conditions, the moon and sky are almost the same color, even without clouds. A sample of the Evening Sky is shown below with a few color annotations added.
Here are the legends explaining the symbols. These are shown on alternating diagram pages.
The center of each diagram is overhead; the circumference is the horizon. The rings mark heights above the horizon of 30º and 60º. In the Northern Hemisphere, the north pole of the sky (NP) will be at a height equal to your Lat. The position of the moon is shown several times on each diagram, because it moves east relative to the stars at about 12º per day. Its position on a given date is marked by a circle around that date. The moon position is shown every 3 or 4 days, which we can use to estimate where it is on other days, including the 15th, the base date for the star data.
The arrows on the left-hand diagrams show how stars in that vicinity move during the 15 days after the 15th of the month, which can be projected back to show their positions at the first of the month. These can be used for estimating positions on dates other than the 15th, as discussed in the Notes on Star Motions at the end of this article.
When the sun (circle with dot) is showing, the sun is up, and it is daylight. The other bodies would not be visible except for the moon—and sometimes Venus, if it is far enough from the sun. In which case, we can figure from these diagrams exactly where it is located, and then look in the right direction, through the telescope of a pre-set sextant, and perhaps get a daytime Venus sight.
The green highlights mark the bright stars (visual magnitude-1). The column headed "S-4" is a relative photo-sensitive response indicating how bright they would appear in a photograph. This is not a useful parameter for us—even though we might, with effort, extract star color information from it; we recommend crossing it out, so it does not confuse anything. Orange highlights we added mark a couple bright mag-2 stars. Our textbook
Celestial Navigation and
The Star Finder Book each have extended discussions of star brightness and the complex visual magnitude scale.
As an aside, they label latitudes with the N in front, such as N25, meaning latitude 25º North. This is unfortunate, because in the marine world of celestial navigation we label latitudes with a following N or S and declinations with a preceding N or S, i.e., the star Arcturus has a declination of about N 19º, which means it circles the earth over latitude 19º N.
These diagrams are best used in print with an overlaid transparency sheet, as we will illustrate in a video later, but for now we can still outline here how they are work (which is actually quite well), and go on to compare this method with other methods.
In practice, when we need to predict the best bodies to shoot in a sight session, we are not likely to be at precisely Lat 0º, 25º or 50º (N or S), and indeed for evening sights, the right twilight time is not likely to be exactly 17, 19, 21, or 23 hr LMT. Nevertheless, we will first pretend that is the case, to see how we match up with other methods, then we will choose some random set of circumstances such as sights at evening twilight on July 10 at 31N, 140W—an approximate point in time and space occupied by many sailors during any of several trans-pacific ocean races.
We look first at a DR Lat of exactly 25º N on July 15, 2019. In the first diagram above, we see the sun is still up at 17h LMT, so let's use 19h LMT as the test example, which must be fairly close to twilight. Here is that sky.
We added the color annotations. Green stars are the mag-1 stars; orange are at the bright end of the mag-2 stars. Jupiter and Mars are also available, as is the moon (empty blue circle) at about 15º above the SE horizon—an estimated position for July 15.
Now that we know what the sky looks like, we need to ask how do we select the best sights? Refer to our books cited above for the basis of these criteria:
Condition 1. We want three bodies, as near as possible to 120º apart.
This is the primary criterion—there is no virtue in taking 4 stars, or even 10 stars. We want the three best, and then we want three or four sights of each one of them.
Condition 2. Bright stars should be favored.
Condition 3. If everything else is equal, the three should be as near the same height as possible.
Condition 4. Generally we want sights to be higher than about 10º and lower than about 75º.
Lower than 10º introduces refraction uncertainties; above 75º stresses the approximations we use to derive the lines of positions and sights higher than that are increasingly harder to take. Either one of these limits can be pushed some if a notably better 120º triad can be formed.
From a practical point, we can rule out the moon in this sky, because it is so low. Even if rather higher, it would not be a good choice, because it must be near a full moon, which is usually bright enough to distort the horizon below it (see our textbook mentioned above). We know it is near full, because it is rising just after sunset. Mars is also on the limit of too low. Thus, as a first guess, we are looking for the best triad of the green stars, or stars and Jupiter.
In practice we would look at this diagram as a printed page of the AA, then highlight the bright stars. Then using a transparent sheet of some form, we draw on the transparency 3 intersecting bearing lines 120º apart. This we can do using any compass rose or universal plotting sheet. Then we rotate that with the centers aligned to find the bodies that are nearest this 120º. This is illustrated in the video. Here are a couple stills of the process.
Here we use a plastic lid from a nice QFC Chef's Salad as a good transparency sheet, overlaid on a Sky Diagrams page printed on letter size paper, the default page size in the PDF. Such a transparent lid can also be used for depth sounding navigation, writing on it with a
Vis-a-Vis marker, which dries but wipes clean with water. See this nav article that includes a section on
line of soundings and also this
video of the method by Starpath instructor Robert Reeder.
The Sky Diagrams are smaller than we would like, but still quite useable. I have to put it that way because the one paragraph Section 2212 of the '58 and '77 Bowditch says the diagrams are of "limited value because of their small scale." We disagree. Below are blowups of work done on the printed sheet above. We rotate the lid to see which triads line up best with the green bearing lines drawn 120º apart.
To numerically compare best triads of sights, we need some way to weight the values of good separation (nearest 120º), good brightness, and heights. If we call these relative weights 70%, 20% and 10%, with limits of 10º to 75º and require stars brighter than 2.0, then this is the best triad [51, 33, and 32] by that standard—although it might not be the best in practice. It could be that one with just a slightly lower goodness factor would be preferred. We can get such a triad goodness factor from the
StarPilot app's Find Best Sights function, which accounts for all these factors mathematically, looking at all possible triads that meet the user defined specs.
Computed values for these stars from the StarPilot output are:
Body Mag Hs Zn
51:ALTAIR 0.8 013°08.3' 086.2°
33:SPICA
1.2
050°12.8'
206.3°
32:ALIOTH 1.8 054°18.4' 336.4°
The challenge in this sky is there are no bright objects in the NW sky. We have 3 mag-2 stars to choose from here: #27 at 1.8, #32 at 1.8, and #34 at 1.9. These are a toss up in brightness (magnitudes are listed to the right side of the diagrams page), but #32 wins out slightly in the equal heights factor, although that is the weakest of the conditions. In practice these are equivalent stars for that direction in this sky. On deck we would take the one that looked brightest or appealed to us for some other reason.
Below is another contender where we favor brightness and give up a bit on the spacing factor.
Here we choose [26, 42, 53], all mag-1 stars. These bright stars would make an attractive set, even though they are not best possible spacing, and technically not the optimum triad. The computed sight data are:
Body Mag Hs Zn
53:DENEB 1.2 016°02.5' 046.9°
42:ANTARES 1.2 031°16.0' 149.2°
26:REGULUS 1.2 026°35.9' 271.2°
Pub 249 Vol. 1
For comparison to the Sky Diagrams, a popular way to select the best triad of stars is Pub 249 Vol 1, a book issued every five years and good for eight. The latest is Epoch 2020. To use it we need a NA or AA to look up the GHA of Aries, then we subtract (or add in E Lon) our DR-Lon to get the LHA of Aries. For this type of star analysis we can simply assume our Lon is 0º, making the LHA = GHA and the LMT = UTC.
To match this exact Sky Diagram at LMT = 19h (recall we will do a random time and Lat below), we look up GHA Aries at UTC 19h on July 15 to get 218º 20.3'. We can then go to the page in Pub 249 for Lat = 25 N, and down to the LHA Aries we found.
The conventions with this pub are the bright stars are in CAPS and the three best are marked with a diamond, namely [40, 42, 26] which have brightness 2.1. 1.0, 1.4). I added the red annotations. The Pub 249 height limits on best sight choices are stricter than we might guess, being about 13º to 60º, which must be related to aircraft sextant sights from higher altitudes. A marine sextant sight at 75º is no more difficult nor uncertain than one at 60º. Also Pub 249 has more weight on sights of roughly equal height, which must be for the same reasons.
Here is the triad Pub 249 Vol. 1 proposes as we would discern it in a Sky Diagram (green circles).
I think this is not one we would have chosen from the many we can find with the Sky Diagrams. Pub 249 is a fast, convenient solution, but it does not always choose the optimum triad, and it can never find one that includes planets. I think we have to conclude that the Sky Diagrams are better than Pub 249 Vol. 1 for sight selection, provided you invest in a good Chef's Salad lid or some equivalent.
2102-D Star Finder
Another popular way to predict best triads is the 2102-D Star Finder. This plastic device from the 1920s is
still for sale, now as a commercial product, although in the 30s and 40s it was an official Navy Hydrographic Office Issue, H.O. 2102-D. We are a strong supporter of this device and indeed have a
book on its use.
The device with its various templates for different latitudes is essentially a hand-held planetarium. You can see when and where bodies rise and set, find the best sights at twilight, or simply go on deck and take sights of 3 bodies in the right relative directions and not even worry who they are. With just a few minutes work you can with this device identify the stars you sighted. The separation of about 120º is found on deck by facing one chosen star, and then take a hard look over each shoulder.
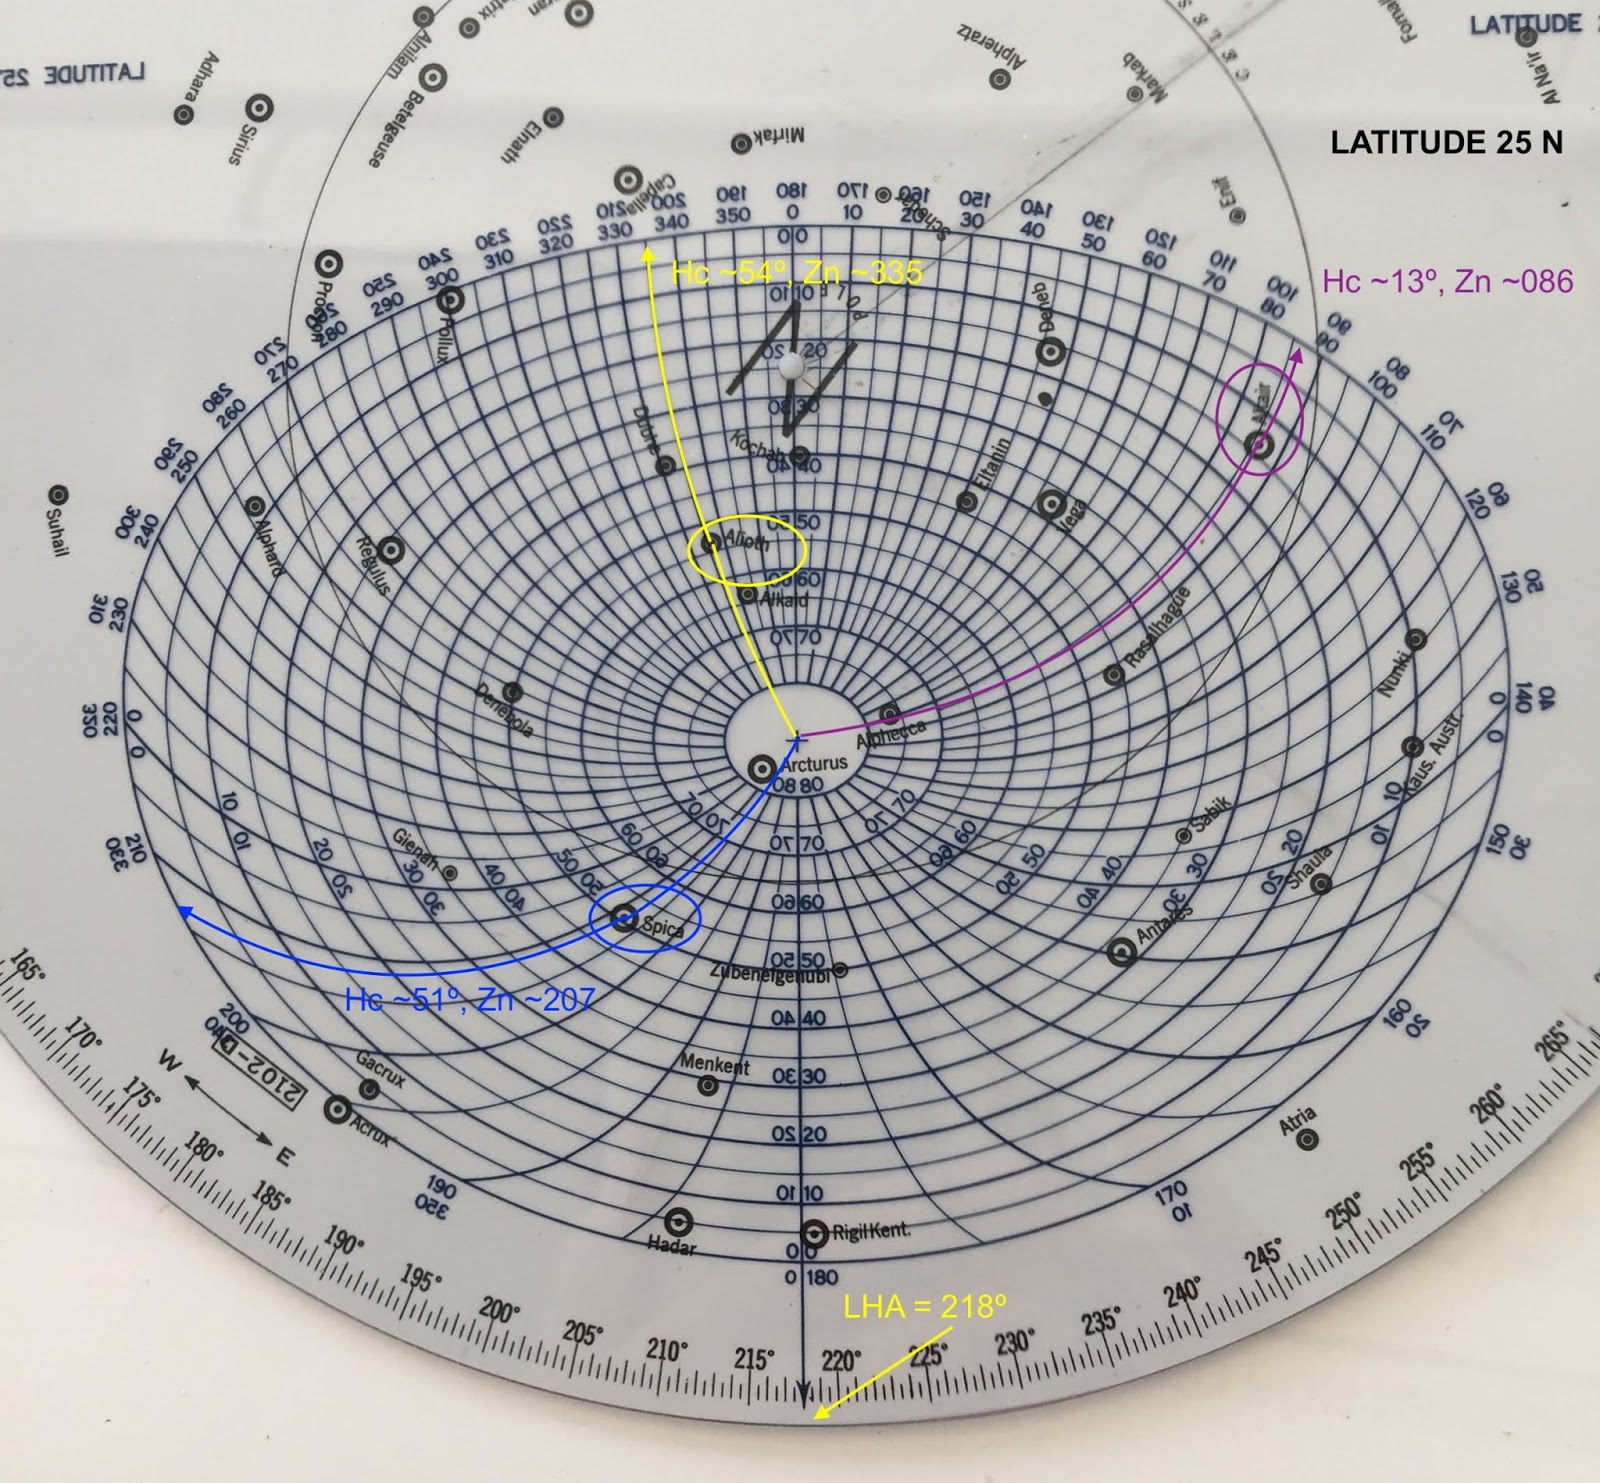
As with Pub 249 Vol. 1, we need an AA or NA to look up LHA Aries (218º in this example) and then, with the 25ºN blue template in place on the white star base plate, we rotate the template to align it with that LHA Aries value as shown below.
The color annotations we added show how to read heights (Hc) and bearings (Zn). The ones shown are for the [51, 32, 33] triad shown above.
In general the way we do best sights selection with this device is to set it up with the right Lat (choice of blue template) and LHA (rotate template on white base plate), and then read off the Hc and Zn of the bright stars, which we then plot on a universal plotting sheet. A sample from
The Star Finder Book is shown below for a different sky.

In short, optimum star prediction with the Star Finder is just using it to make a big Sky Diagram! We could also annotate such a plot with star heights, but in this case we only plotted bodies with usable heights. To include the planets or moon, use the Star Finder's red template and other NA or AA data to plot them on the white base plate, then we can include them. But that is extra work that is all done for us with the Sky Diagrams.
The one advantage of the Star Finder solution is we are using exact times for the LHA setting, with latitude templates every 10º rather than 25 in the Sky Diagrams, so we end up with fairly accurate values of the Hc and Zn, which are valuable for setting up the sextant to take the sights. Using Sky Diagrams the Hc and Zn we get are more approximate. On the other hand, once we have determined the best triad from the Sky Diagrams, we can compute accurate values of Hc and Zn for the actual sight taking using sight reduction tables.
Sky Diagrams at random sight times and latitudes...
A LONG ANALYSIS WITH A SIMPLE CONCLUSION
We have seen that in an idealized example, meaning a case that matches exactly the date, time, and Lat of one of the diagrams, the Sky Diagrams are an excellent, if not superior, way to manually find the best triad of sights. Now we need to see how much harder it is for realistic sight times that do not match one of the diagrams. To do this, we choose a random but realistic evening twilight on July 10 at 31N, 140W. This involves, on some level, a triple interpolation: Lat, LMT, and Date.
First we gather the real data, which we can get from NA or AA. Evening sights are taken between civil twilight and nautical twilight, which at 31N on July 10 (see
our text on this determination) are 1934 and 2007 LMT. We might then plan our sights for the midpoint of this 33-minute sight session, namely 1950 LMT on July 10 at 31N.
We have stock diagrams at 25N and 50N, so at 31N we are looking at a sky that is roughly halfway between these two. Our target time of 1950 is about 20h, which is halfway between the 19h and 21h given. Also we are looking at July 10, which is 5 days earlier than the stock diagrams, which are all valid on the 15th of each month. To do this numerically seems daunting; the right sky is roughly the average of four of the stock diagrams.
But do we really need to do that? After all, I know from direct experience that we can sail across the Pacific (WA to HI) and pretty much use the same three stars for most of the voyage, maybe shifting choices once, only toward the end. This is a latitude change 27º (48 to 21), spanning 3 time zone descriptions (+7 to +10). So chances are the top choice triads are not going to change much for rather large changes in latitude and date. (In one sense, discussed in the star motion notes below, we carry our triads with us as we sail west.)
So let's start by just rounding everything to the nearest diagram, which the Sky Diagram's explanation section hints is doable, referring to interpolation as "... such refinements are not usually necessary." But they are in airplanes and we are in boats, so we have to test this.
A sight session spanning times of 1934 to 2007 can be rounded to the 19h, and Lat 31N we round to 25N, and July 10 we round to July 15, then we are back (coincidentally) to the example done above (July 15, 19h, 25N), whose technically best triad was [51, 33, 32]. We can now use StarPilot to see if this is the right answer for 1950, July 10, at 31 N, which we compute specifically for those values, shown below.
And yes, that is the best triad. Not only does this rounding method work, in this case this triad at a special time and Lat is even better than the base diagram, as shown in this StarPilot output.
Without going into details of the solution, we can see that even though the Hc and Zn of the stars are somewhat different in these two skies, this is not just the same triad, it is numerically superior at the special time with a goodness weight of 2.2 compared to 1.8.
In short, we have an easy way to test whether or not
rounding everything to find the right Sky Diagram to use will be dependable: we just do that in multiple cases, and then compare the answers with the numerical solutions from StarPilot. The question is, how do we choose the random sight times to test? One way is we look at the vessel positions from any documented ocean crossing and choose a few positions from that. We just happen to have a perfect candidate: our published training exercise (
Hawaii by Sextant) based on a July, 1982 voyage from Cape Flattery, WA to Maui, HI, carried out purely by cel nav. We will just assume this took place in July, 2019 and select several sight times and locations along that hypothetical voyage.
Here is the route and the points we choose to test.
First the easy part, we just look at what triads the StarPilot found at evening and morning twilight at these positions and dates.
The above optimum triad solutions are computed using the exact twilight times and latitudes of these hypothetical sight sessions, both for morning and evening sights. The Lat, Lon values shown are in the StarPilot's shorthand format, designed for quick input: 34.567 means 34º 56.7', etc. Here are now the rounded values that we use for the Sky Diagrams.
Now we look at the Sky Diagrams for each of these rounded sights to see what we get from them compared to what we know are the optimum triads.
These are the morning sights. The blue and orange triads are the the ones we know from the exact data are the technically optimum choices. The red triads are the ones we would have selected from these stock diagrams using the same quality criteria. We get the right choices, even in this dramatic rounding of all values, in all cases but #6 and this one is very close.
These are the evening sights, with the same conventions: blue, green, purple, and orange are the known optimum triads for the precise conditions, and red is what we would have chosen from these stock diagrams without knowing anything more. In all cases but evening sights #3, we get the right choice by total rounding to the charts available.
However, we need to look closer to see if #3 is really wrong. A real navigator would not choose the moon in the #3 evening sights. StarPilot chose it because it generated the best triad quality score, but we know not to choose a moon at ~30º high, so we would have chosen the StarPilot No.2 triad, which is star 37 for that sight. The triad goodness factor was almost the same.
Second, the real Lat for this session was 37.44, which is just barely leaning to 50N over 25N. In fact, we have several arguments here to override the strict Lat rounding, and instead go to 25N. At 50N the sun is still up, and by the time it sets, the chosen #12 (bright Capella) would not be an option. So it would not take much reasoning to use 25N and in that case all matches up.
I think that is all the testing we need to do! Recall, too, that these are analyses and decisions we make for the first sight session in a cel nav voyage. If we choose something wrong the first night, we then know it, and how to correct it. Then we are right the rest of the voyage until this quick look at the Sky Diagrams changes our mind.
Also I should point out that all of this best bodies planning can be done before you leave the dock! We see that there is broad leeway in times and latitudes that still come to the right choices, so you can DR your crossing and make a table of best bodies for each region of the route. Chances are you will have the right choices in hand as you cross without further work. It is an excellent exercise that gets you thinking about the sky before you get there, which is just one more step along the path of good seamanship, which is preparation.
A bonus of these diagrams is once we find our target triad, we can also draw in our heading line, as shown below, and this way quickly picture where the stars are located relative to the bow.
Here we have bright ones on the port bow and quarter, and the fainter one roughly on the starboard beam. With such a layout you can anticipate if it will be needed to change headings, if possible, during a sight session, or maybe set sails will prevent this triad, so look for another.
Star Brightness and Sun-Moon Daytime Fix
There are two tables in
The Star Finder Book that help with choosing best sights. Table 3-3 tells what days and times of month we can get a good sun-moon fix during the day, along with other special uses of the moon, and Table 3-1 tells how perceived brightness differences can be determined from magnitude differences. A mag 1.7 star, for example, is about 40% brighter than a mag 2.1 star. Pub 249 Vol. 1 with its height limit of 60º often has to dip into the mag-2 stars, which sometimes limits its ability to find the best triad.
In Table 3-3 we learn that one chance for a good sun-moon fix is moon age days 6 to 8, a waxing half moon near the meridian at sunset, with best sight time in the mid afternoon. In principle we can also get such information from the Daytime skies of the Sky Diagrams. We want the sun and moon about 90º apart, which means half moon. The days of the half moons can be found from the NA, which lists moon age on the daily pages (6 to 8 or 21 to 23), or from the AA, which lists illumination on the daily pages (~50%). In the latter we can also find these dates at a glance from the Semiduration of Moonlight Table, intended for some purpose in Polar Navigation.
From the Semiduration table In July, 2019 (page A155) we have a waxing half moon on day 9, and a waning one on day 25, which can be confirmed with their illumination data. Now we can note these positions on the daytime sky diagrams to mark when we should look out for good sun-moon fixes.
The days of waxing and waning half moons are plotted, along with the
Celtic Goddess Symbol, a reminder about waxing and waning. We immediately see several important things. First, the exact days of half moon are not the optimum sight days, which we find from the Sky Diagrams by making their relative bearings near 90º. We also learn here at home what many celestial navigators once learned underway. Namely, sailing into the tropics in late June or early July leads to difficult sun only navigation. As we sail under the sun, those relying on noon sights alone are stuck for some days without sights. The sun is just too high at midday. Thus, we recommend learning all cel nav, not just sun sights.
Here we see that at latitudes anywhere near the sun's declination, sun-moon sights will be very difficult. One of them will be near overhead. These sights are difficult because the crucial technique of rocking the sextant is difficult, because we do not know which way to look when we rock. Our textbook discusses ways around this.
On the other hand, at higher or lower latitudes we can spot the best times and days do to the sights with the Sky Diagrams. In this application, we are using the plotted moon positions to tell us the date, and then we assume that the sun's position on that date at that time will be about where it is on the 15th. Below we test a few of these conclusions with the StarPilot. Namely, we take the proposed time and date based on the exact time of half moon, and then we shift the date to improve the sights based on Sky Diagrams, then plot out this proposed sky with StarPilot.
All show good 90º intersections. In practice we have a 2 or 3 day window on these sights for usable fixes, but this way we can spot the best time. Indeed, with a highlight marker for sun and moon we do not even need to look into half moon times. We can go direct to the diagrams and look for 90º opportunities. Likewise for sun-Venus sights. The Sky Diagrams do a fine job on these daylight sights.
Grand Summary
My conclusion is that a printed copy of the
Air Almanac's annual Sky Diagrams and a transparent plastic container lid is the easiest and fastest way to manually choose the optimum triad of celestial bodies for a sextant sight session. Several colors of highlight markers helps. The diagrams are 76 pages of a free PDF copy of the
Air Almanac, published annually. We recommend they be considered part of the celestial navigator's standard toolkit.
I had to specify "manual" solution in that conclusion, because if we slip into the world of electronics, we get other solutions, notably the StarPilot, which offers state of the art sight planning. That process is discussed in the
StarPilot User's Guides, and related videos. Its quick and easy interface was key to the detailed analysis carried out above.
The attraction of the manual solution is that those studying cel nav, if not to pass a USCG exam, are generally doing it to be a back up to electronics failures on an ocean passage. In that event, we go back to old-school cel nav, watches, books, and plotting sheets. What we are adding here is the suggestion that a print out of the few pages of the Sky Diagrams that cover the month of your voyage would be a good addition to your preparation of for an all-manual solution, not to mention that the full (free) PDF of the
Air Almanac is a back up to your other almanac data.
Let me conclude with reference to a related discussion "
Why study cel nav in the age of GPS?"
For those working through our ocean navigation exercise in
Hawaii by Sextant, we added a set of the July 1982 Sky diagrams to the support page for that book:
starpath.com/HBS
Notes on Star Motions in the Sky Diagrams
TOTALLY OPTIONAL, NOT NEEDED
I hope it is clear from the above notes that we do not need to know more about these diagrams to efficiently use them to find the best triads to start with in any sextant sight session. But there are ways to fine tune the interpolations based on known star motions and how they appear in these diagrams.
Star locations within each diagram are affected by two major astronomical motions. First, the earth circles the sun once a year (360º in 365 days), which is about 1º per day. This means that at the same time on consecutive evenings, the stars will be about 1º farther to the west than they were the previous evening at that time. This is indeed how the summer sky evolves into the winter sky—how the first sighting of Sirius before sunrise told ancient Egyptians the Nile was about to flood.
This orbital star motion is indicated by short arrows on the left-hand diagrams of each page (1h, 9h, 17h). A sample is shown below that we have annotated in red.
Each diagram is valid for the 15th of the month. These arrows represent how far, and in what direction, a star in that vicinity will move during the 15 days following the 15th of the month, and from this we can project back to show where it would have been 15 days prior to the 15th, as shown above. This motion is what we use to estimate star positions for dates other than the 15th. This is a
date or
orbital correction.
The red rings about the pole that we added are fairly good star tracks on this diagram at high latitudes, but these paths are squashed into ellipses at lower latitudes.
The second motion we need to account for is a
time-of-day or
rotation correction to account for the rotation of the earth about its axis on any given day. This causes the stars to move 360º in 24 hr or 15º per hour, which is the difference between, say, the 17h diagram and the 19h diagram. We can see that in the diagrams themselves.
To illustrate this daily motion, we show here the 21h diagram overlaid with the 17h and 19h locations of stars #53 and #46. At 15º per hour, in two hours they move about 30º.
Despite the complexity of depicting a dome of stars as a flat sky diagram, these two motions lead to what many navigators are well aware of. Namely, the sky we see above us now will be exactly what a navigator located 15º of Lon west of us will see see one hour later. The dome of fixed star positions rotates about the pole, 15º each hour. This does not apply to moon or planet positions that are notably moving relative to the stars.
Perhaps less often thought of, the sky a navigator sees on the 15th of the month at a specific time is the same that was seen an hour later from the same place on the first of the month. To see how this works, rotate the sky backwards by 1º per day for 15 days, and then advance the time we look at it by 1 hr. The 1-hr forward in daily rotation of 15º clockwise just cancels out the 15 days of of backward orbital correction of 1º per day counterclockwise. Likewise, the sky we see on the 15th of the month is the same as will be seen on the 30th of the month, one hour earlier.
In other words, the 19h diagram that is valid on the 15th of the month is also valid on the 1st of the month at 20h, and on the 30th of the month at 18h. Here are a couple screen caps from the StarPilot app to illustrate this behavior at 25º N.
On the 15th at 19h, we see the stars with an optimum triad marked, plus the moon, Jupiter, and Mars. The moon was not visible in the other skies, and we see Mars notably move relative to the stars in these views. The star motion rules we are discussing apply only to the stars. In this case, Jupiter must be so far away from the sun that it effectively behaves like a star. This is common for Jupiter and Saturn, but Mars and Venus will usually move notably from day to day.
The summary of this is: Back 15 days and forward 1 hr gets to the same sky; Forward 15 days and back 1 hr gets to the same sky of stars—moon and planets not counted. Put another way, we can round the actual sight date not just to the 15th, but we can use the 1st or 30th, whichever is closer. If the 1st is closer than the 15th, then use the diagram that is 1 hr later than your sight time, and if the 30th is the closest, use the diagram that is 1 hr earlier.
So with that background, we see that we could fine tune the choice of diagrams depending on the date relative to the 15th—but we have also seen that this is not necessary!
I include this discussion of star motion because it is mentioned in the official explanation to the diagrams, but without details. To that I must add that I have in fact looked for cases where we could take advantage of this date correction for better choices, and I could not find any. In about half the cases, the date-corrected time will be an even hour, for which there is no diagram, so we are left interpolating again. The earlier conclusion stands; there is no need for further interpolation. Round everything and choose your stars. If near halfway between any two standard latitudes (0, 25, 50, 75) then consider other factors that might cause you to lean one way or the other.