The workhorse of global ocean current forecasts in grib format is the RTOFS model. It provides ocean surface currents and sea surface temperatures (and ice) forecasts globally at 4.8 nmi resolution out to 7 days, every 6h for 4 days, then every 12 hr for the next 3 days. Its prime attraction is its ready availability from just about any program or app that shows grib files, in large part because it is available via Saildocs.
RTOFS may not be dependable very near shore and its resolution limits its use in any inland waters it reaches into. An alternative for waters adjacent to the US is another US Navy model called NCOM. This current data is likely superior to RTOFS for ocean waters where both are available. It is definitely higher resolution at 2.0 nmi compared to 4.8 for RTOFS. It extends out to 4 days with data every 3 hr. It also covers near coastal waters and indeed reaches into large inlets and bays such as Strait of Juan de Fuca, and the Chesapeake and Delaware Bays, among others.
The only disadvantage of this data is its lack of broad availability underway. If you happen to be using one of the top commercial weather programs such as Expedition or Luckgrib, then you can request this data for specific Lat-Lon windows and time periods from within those two programs. That can be done on shore or underway. You can even download the data from either of these apps and then export them to be used in a different app if you cared to. But not every one has one of these fine programs.
What I want to stress here is, that for work on land, or more specifically, when you have an internet connection available, anyone can easily get this NCOM data for planning or analysis, and it will display nicely in any of the popular navigation and weather programs, such as OpenCPN or qtVlm, as well as other popular commercial programs such as Coastal Explorer or TimeZero. Luckily, the data are subdivided into several regions, but even so, these regional files are too large to load by sat phone or cell phone at sea... with maybe the exception of 4G or 5G service in coastal waters, which is evolving technology.
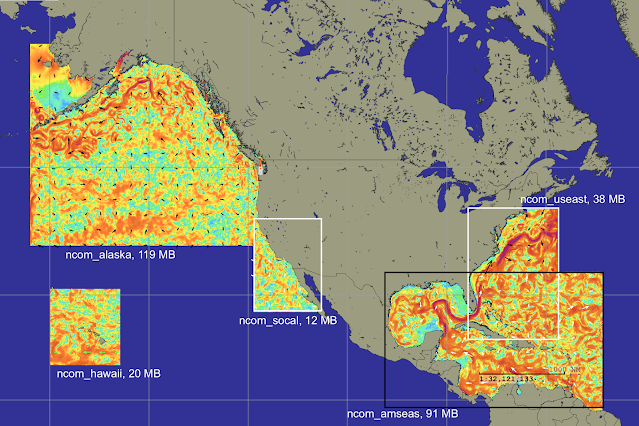
Available data sets are shown in the picture below.
The files are located at this link
https://ftp.ocean.weather.gov/grids/operational/NCOM/regional/GRIB2
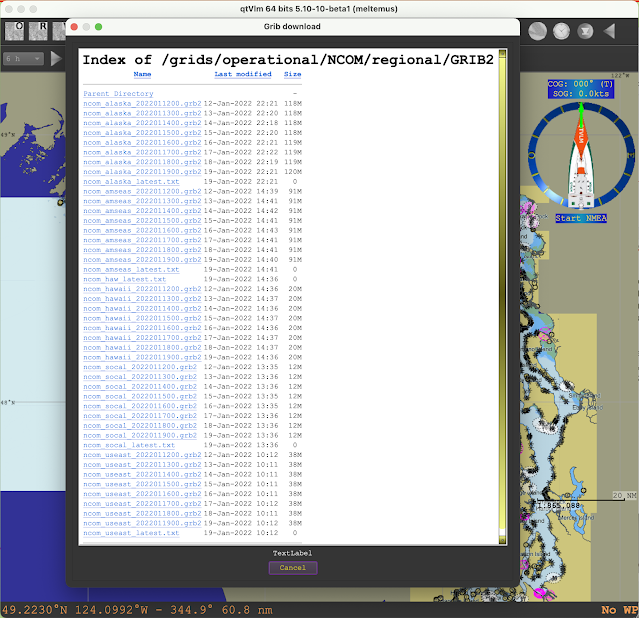
You can download them directly from that site, which includes the last several model runs; we would typically want the most recent. If you are using qtVlm you can identify this URL as a "Custom grib" source and then access the files directly within the program, which loads them as well. As an example of such an interface, that set up page is shown below
Then when ready to load the grib into one of three slots, we select the Custom Grib tab and see this:
Click the file and the data loads into the program. If you have not viewed currents before in your nav program, you may need to go to the grib display set up to select display options.
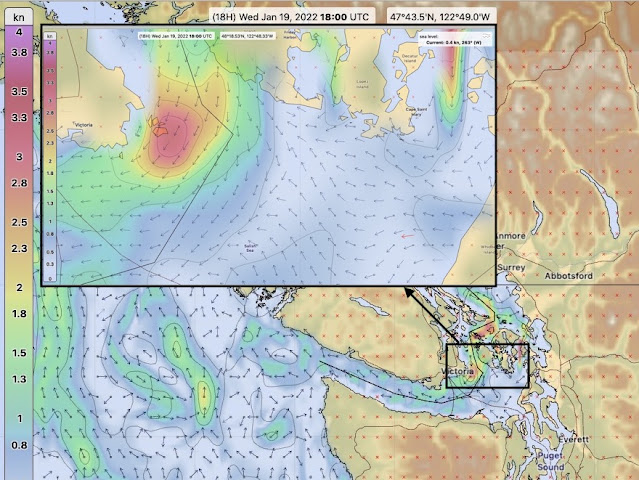
Besides the value for ocean routing, an intriguing possibility is to use these data to supplement routing on inland waters where currents, primarily tidal, can have such a large effect. Below is an example of the NCOM forecasts reaching into the Strait of Juan de Fuca viewed in LuckGrib.
There is a lot of detail forecasted in this model, much of which we can actually check.
Here are a couple more examples from the Rhode Island Sound area, this time looking at the data in qtVlm.
There is not a color bar scale. The values at the cursor show up in the status bar. But roughly, medium orange is 0.6 or 0.7 kts; darkest orange is 1 kt; yellow is 0.3 or 0.4 ; green-blue is 0.2, 0.1.
Comparing this to NOAA tidal current predictions is not very fruitful, but that should not be discouraging. It can be done, but it is difficult, primarily because the tidal current predictions are given as reversing, whereas in this open water they are largely rotating. Thus reading carefully you see NOAA tells us only the "average" of the flood and ebb directions. If you look at any one specific time, you are likely not seeing water flowing in the "average direction."
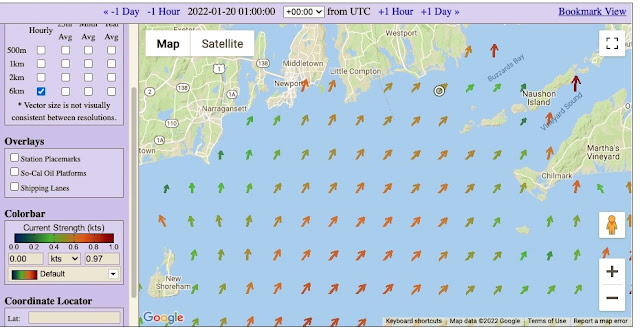
We do better using HF radar measurements of the currents, which you will find also do not agree with the NOAA tidal current predictions, but they do offer encouraging support for the NCOM forecasts. A sample is below for the time of the above data.
Here there is a color bar, and I think it is fair to say that this is about all the level of accuracy we should impose on these measurements. We can click each picture for precise read outs, but that might be over doing the actual accuracy. All and all, the general flow and rough speeds are about right. We do not really need more than that... but it would be nice to see a case where the flow is notably different, and that is shown below.
This is a view of the area 16 hours earlier. The speed color code is the same as above, and the range in speeds is about the same, but the flow is notably different, with a clear eddy below Martha's Vineyard. The HF radar measurements at this time are shown below.
We see here a very nice confirmation of the forecast. The eddy shows up in about the right place and the other changes in flow pattern from above are reproduced.
These are just two ad hoc checks done here at random at the time of writing, but they look promising and hopefully with these notes more navigators will look into this resource and test it various ways. It seems logical for coastal ocean routing, but we have a lot of work to do to learn of its value for more inland sailing.


No comments:
Post a Comment