After spending some time trying to build a KML file that would reproduce OPC graphic maps in qtVlm, I have had to give up for a while on this. We used it successfully for the small (~150 nmi square) regions for presenting ASCAT data, but for large areas, it seems the KML format will not inherently reproduce a mercator projection. So that explains why, for now, we are not doing this with KML files which would in principle bring the map link and the georeferencing info into qtVlm in one easy step.
Instead, we have a couple of relatively easy steps that must be done just once, and then they are saved for later use.
Here we want to automatically load the latest Atlantic surface analysis georeferenced into qtVlm, so it looks like this:

To do this use menu Gribs/Weather images/Open a weather image and then choose a tab (1 to 8) that looks like this.
In the "File name" field type this link: https://ocean.weather.gov/A_sfc_full_ocean_color.png
and then set the other parameters as shown below.
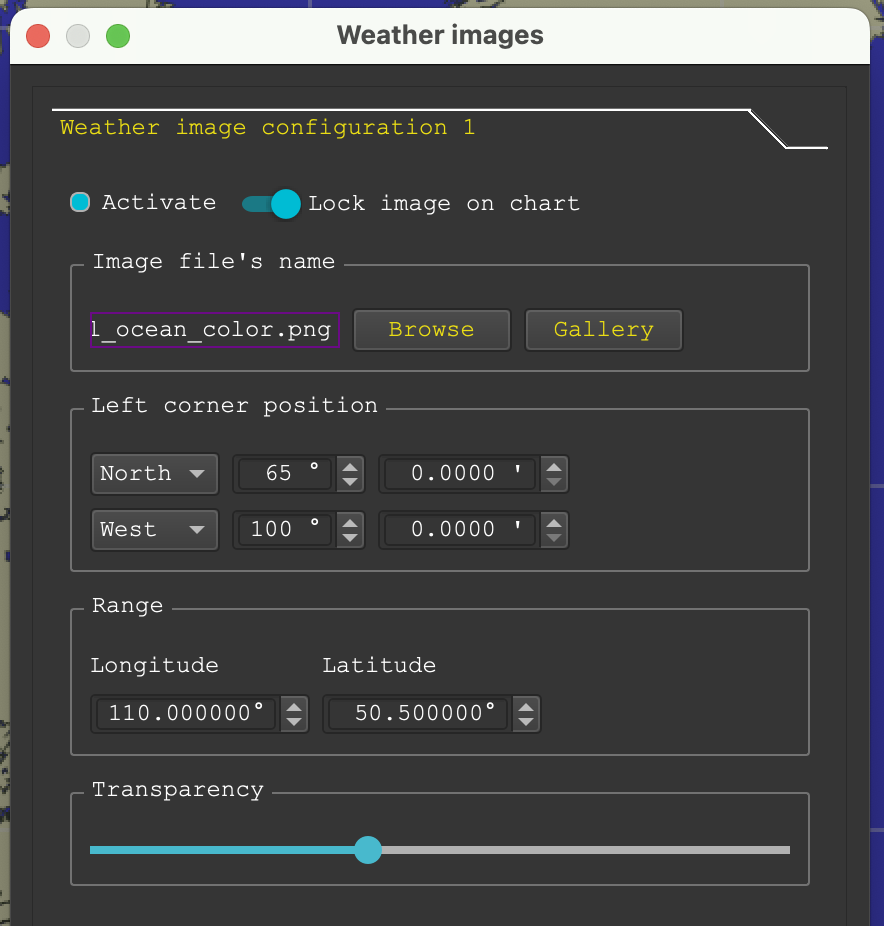

Choose another tab (2 in this example)
In the "File name" field type this link: https://ocean.weather.gov/P_sfc_full_ocean_color.png
Note the file name is the same except for P for Pacific vs A for Atlantic
and then set the other parameters as shown below, which are also the same except for the location of the top left corner coordinates.

With one of these images in view, which are vetted by professional human meteorologists, you can over lay a numerical weather model forecast at the same time to evaluate it since it has not been vetted by humans.

In this case we see near perfect agreement that the OPC maps are more and more looking just like the 00h forecast of the GFS, meaning in large part that the GFS is pretty good. But despite not learning more about the lay of the isobars and hence winds, we do see from the maps where the fronts are located; fronts are not shown in the GFS model outputs we get in grib format.
No comments:
Post a Comment