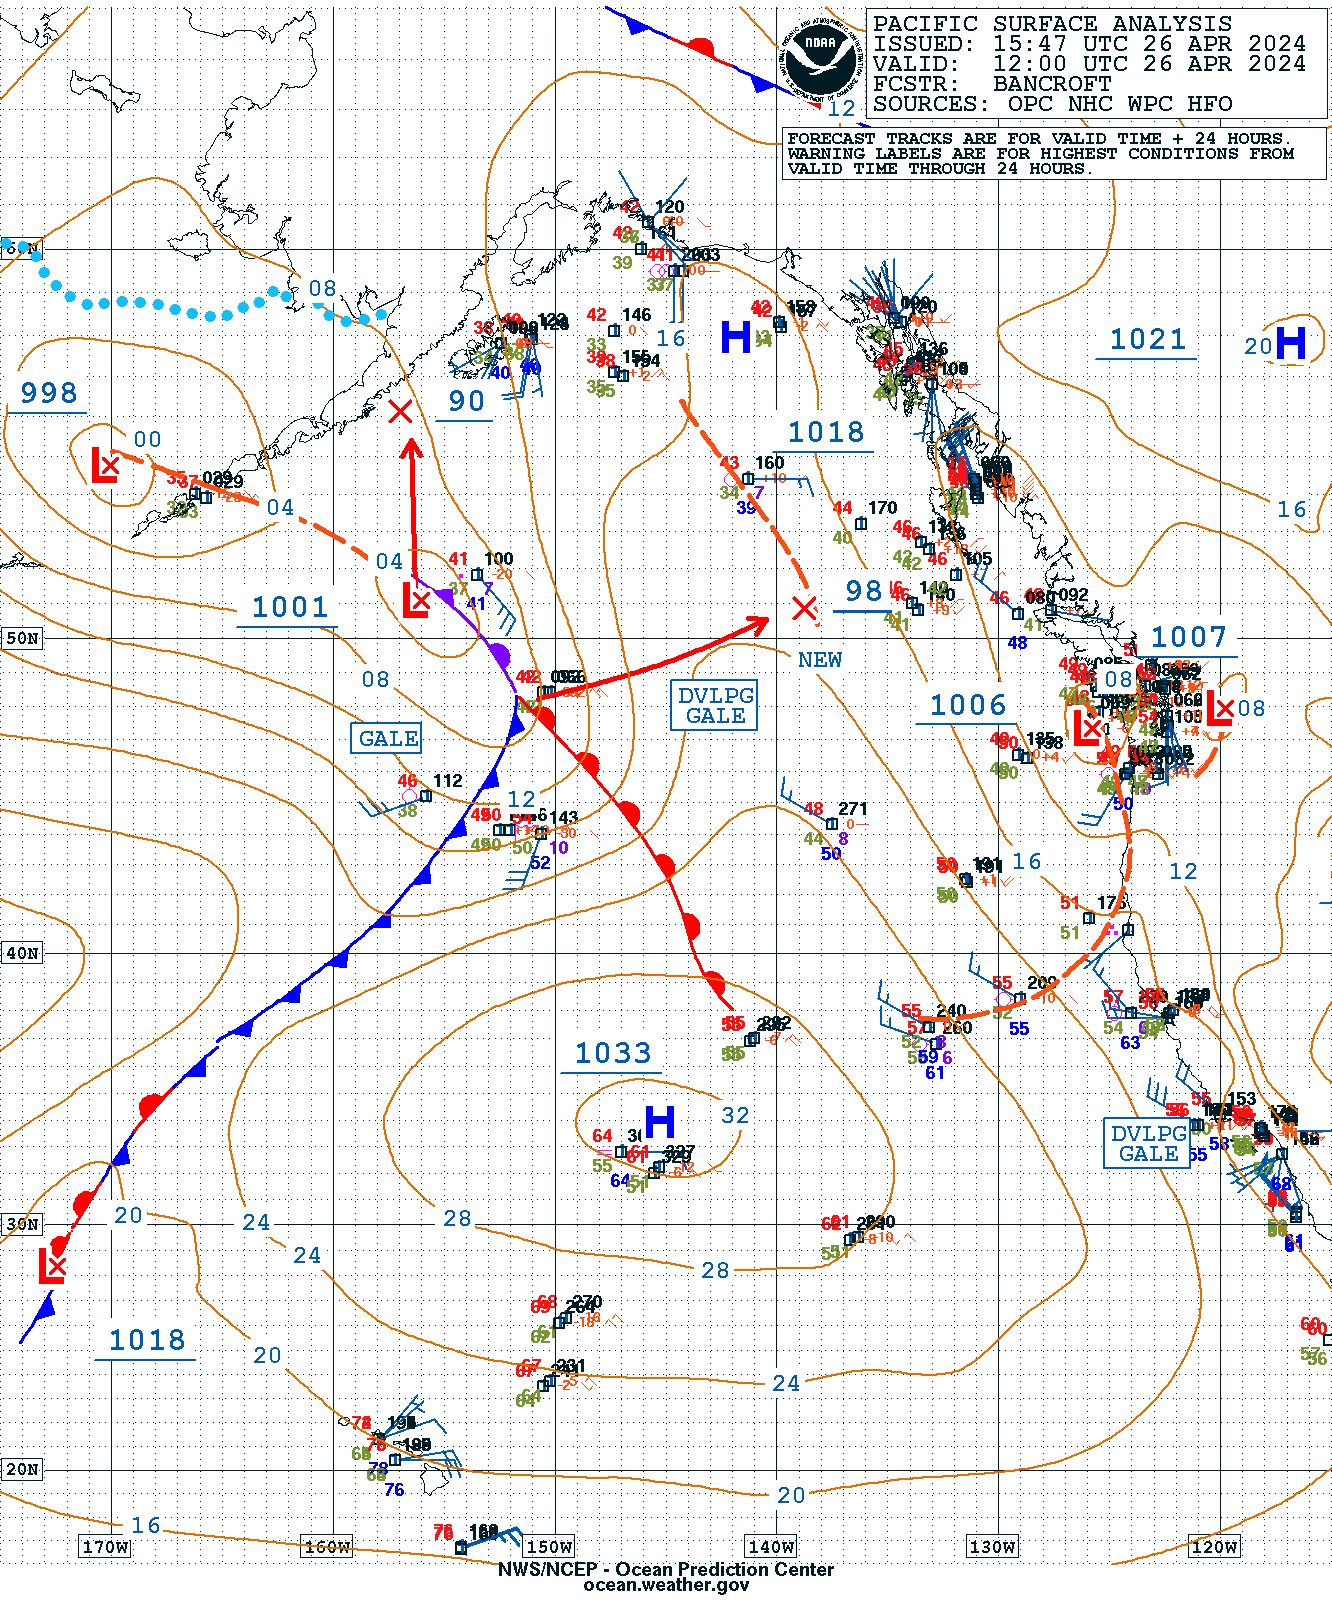
When we are underway paying $1.50 per minute for satellite phone time, we clearly care if we can get the same weather map from one place that is much smaller in size than from another place, not to mention that some services might not even allow larger files to be transmitted. The latest surface analysis of the Eastern Pacific, for example, can vary from 13 to 312 kb, with multiple options in between. Again, these are the same maps.
But not only download air time matters. Storage space on our computers or tablets underway, as well as the time it takes to process the files when we look at them in different applications are also factors that make us aware of file size.
Our present project at Starpath is studying ways to get these graphic maps into an echart program (i.e. convert them to nautical charts) so we can see our precise position on the map, read precise ranges and bearings, and also to compare these professionally produced graphic products with the vectorized grib format of single numerical model predictions, such as the GFS. With the weather map made into chart we can overlay the grib forecasts right on top of the graphic forecasts.
We want to use the digital grib forecasts as much as we can because route analysis is much easier with them, We can also read digital values of wind and pressure at any point on the map—not to mention that if we are using an automated weather routing tool we must use the grib files.
But any single numerical model forecast might not be right. We need to compare them with the forecasts made by the NWS, who are looking at several models in addition to the GFS as well as other factors when making their forecasts. The pure GFS will be close to the truth much more often than far from the truth, but actual differences can be crucial in some circumstances, especially with newly developed or fast moving systems. It is simply prudent navigation to compare them on some level.
To make a chart out of a map, we first need the graphic file of the map, which leads to this topic at hand.
Our own Starpath Custom Briefings pdfs discussed below (one for the Atlantic and one for the Pacific) are very convenient ways to request any of the maps, both onland and underway, so we will look at this option after looking at the more standard sources.
We will use the 12z Eastern Pacific Surface Analysis for the example, but other products have similar results. And we list file size as downloaded—which has to be said when the options include tifs, which increase in size notably when you do anything at all to them! Some maps are presented sideways, so they have to be rotated to be read or manipulated, which if tiffs will notably increase their size, but this all takes place after they are on your computer.
Note too that capitalization of name and extension matters in the file names. NOAA now has some in color and others in black and white (BW). Below we give dimensions as w x h as viewed in normal portrait mode. Sideways means we get the map in landscape mode and have to rotate it.
Where to download the maps
The main source of weather maps is the FTP site at NOAA, all are there with a specific file name for each map along with (for some, not all) a file name that represents the latest version of that map. For example, PYBA05.tif is the 12z surface analysis of the East Pacific. It updates once a day at about 1430z to the current day’s map for 12z, but the file name remains the same. Likewise, PYBA07.tif is the map for 18z. But there is also a map called PYBA90.tif which is the latest version of this 12z analysis. It could be the 00z, 06z, 12z, or 18z map, which ever has updated the most recently. Usually we want the latest version, but there could be reasons for looking at a specific map that is outdated.
If we know the file names, we could get them directly from the FTP link. But there are several sites that index the maps so we do not need to know specific file names... but what is at the other end of these links is what we look at now. In passing, the system of keeping the same file name and updating the contents daily is a real blessing when it comes to working with these maps. Some other sources, and most European maps, have the date and time built into the file name, which really complicates any automated acquisition of them.
 |
| File names for NWS surface analysis maps. From Modern Marine Weather |
Starting with the neat shortcut link weather.gov/marine, which is a nice portal to all weather products, we can find the graphic map links. They link to map indexes in three different formats, but as we shall see, it is only the index layout that changes, not the maps.
Since the latest NOAA change of links, some of these notes are not valid. We need to check when we can. One path to the new map locations can be now be found from the fax schedules themselves.
Atlantic Ocean fax schedule
Pacific Ocean fax schedule
Alaska region fax schedule
Hi region fax schedule
http://tgftp.nws.noaa.gov/fax/PYBA05.TIF 37 kb 1446 x 1728 BW sideways
http://tgftp.nws.noaa.gov/fax/PYBA05.gif 90 kb 1446 x 1728 BW sideways
http://tgftp.nws.noaa.gov/fax/pyba05.gif 90 kb 1446 x 1728 color upright
Condensed versions (same as main links but only latest) http://tgftp.nws.noaa.gov/fax/ptreyeslatest.shtml
http://tgftp.nws.noaa.gov/fax/PYBA90.TIF 37 kb 1446 x 1728 BW sideways
http://tgftp.nws.noaa.gov/fax/PYBA90.gif 90 kb 1446 x 1728 BW sideways
http://tgftp.nws.noaa.gov/fax/PYBA05.gif 90 kb 1446 x 1728 BW sideways
http://tgftp.nws.noaa.gov/fax/PYBA90.TIF 37 kb 1446 x 1728 BW sideways
Mobile version (latest only) at https://www.weather.gov/source/marine/mobile/hfreyes_mobile.html
http://tgftp.nws.noaa.gov/fax/PYBA90.gif 90 kb 1446 x 1728 BW sideways
So knowing the maps are the same you can choose the index presentation that best meets your needs.
These links (except for the color maps) are direct to the FTP site: http://tgftp.nws.noaa.gov/fax. The color maps seem to be a product of the Ocean Prediction Center, which I believe is where they are produced. They also provide a side link to another interactive radiofax schedule, but the maps we get there are in slightly different sizes than on the FTP site, which makes them less attractive for our purpose of making echarts out of them. Notice too that they use a different format for the file names—extensions and names all lower case.
http://tgftp.nws.noaa.gov/fax/pyba05.tif 312 kb 1440 x 1728 BW upright
http://tgftp.nws.noaa.gov/fax/pyba05.gif 105 kb 1332 x 1600 color upright
http://tgftp.nws.noaa.gov/fax/pyba05bw.gif 86 kb 1440 x 1728 BW upright
A very convenient way to request maps on land or underway is our own Starpath Custom Briefings. These are pdf graphic indexes to each of the maps, organized by map type and forecast period, including notes on each of file size and update times. The link above explains the use of the briefings. These briefings make use of the wonderful service of saildocs.com, which reduces the file sizes by about a factor of two. This is a blessing when underway on limited bandwidth.
In the Starpath Briefings we link to the saildocs latest version of each map, which you request by email from saildocs with a single click and send. In the example we are using here, they will send back to you in return email the PYBA90.TIF that is normally 37 kb at 1446 x 1728 reduced to 18 kb at 864 x 723, also sideways. This tif format will double in size when you rotate it and save it, but it was small when you downloaded it. The reduced file size is still plenty legible, but it does not get better when the size doubles after rotating.
Download Starpath Atlantic Maps Briefing pdf index
Download Starpath Pacific Maps Briefing pdf index.
For Reference (not needed when using the Starpath Briefings):
List of all Pacific Weather Map File Names
Alaska map file namesHi map file names
Gulf of Mexico and Carib file names
Selected International map file names
Selected UK map file names
§§§
2 comments:
Is there a way to get weather charts for the indian ocean?
Just realized, long after the fact, that we did not answer this.
Here is one option from BOM http://www.bom.gov.au/australia/charts/darwin_MSLP_00z.shtml
or directly from the Indian Met Dept http://nwp.imd.gov.in/wrf27pro.php, they also run some WRF models for some waters.
Post a Comment