
When we learned that Hurricane Florence was headed toward NDBC BuoyCAM 41049, we set up a convenient graphic way to monitor the relative positions of storms to this and other buoys in its track so we could know when to look at the pictures. The pictures update every hour, so we need to catch them at the right time to learn what we can.
Finally a working system emerged to view all the BuoyCAMs in the form of a KML file that loads into Google Earth (GE) superimposed onto the NHC storm track chart that automatically updated every hour. We even eventually got it working in smart phones. Then when all was in place and working, sure enough, Florence went by Buoy 41049 in the middle of the night when the cameras could not see it!
For those unfamiliar with the BuoyCAM program, here is a short video overview.
Missing the storm's closest point of approach was a disappointment, but not the end of the world. The storm had to approach several more data buoys and one more BouyCAM on the way to the coast, and we could try again, which we did. Also this whole study is primarily to prepare for other systems that will come by later in the season.
In each case, we need to correlate the data we see with the actual range and bearing to the storm at the time of observation, which we get from other sources. For tropical cyclones in the Atlantic and Eastern Pacific we will get this from the NHC. There is only one BuoyCAM near HI, which could see storms coming up from the SE, in which case we go to the CPHC for that data. We have two Atlantic cases to look at below to see what we might learn.
First there is the issue of what exactly are we looking at in the pictures? Each BuoyCAM has 6 cameras on it dividing the horizon into 6 segments, 60º across. The one on the left has a true direction label on it. The location of that direction within the frame has no significance. We can think of it as the approximate direction of that camera. Below is how we concluded that based on measured bearings to known sunrise directions.

The conclusion is that the bearing shown marks the general direction of that camera, but not precisely. The bottom 3 were all close, within about ± 15º, but the top one was off 30º. We have since improved our method of scaling these pictures (shown below) and indeed our new system seems to have found a buoy whose camera was stuck on the wrong direction. But in looking at very many of these, that is the only one we found off. This was reported to NDBC, they confirmed our observation, and it is on the list now to be repaired on the next maintenance voyage.
Now we can look at the sequence observed as Florence approached BuoyCAM 41049 so you can see what the sequence looks like, with no adjustments. The top is most recent, after the storm went by; the bottom is the previous day.


We notice the seas were rough at sunrise after it went by—the surface slope we see in the right-hand pictures at sunrise 0510 AST, Sept 11, are waves, not the horizon viewed from a tilted camera—but we do not see much interesting in the clouds before or after... at least without further manipulation. If the BuoyCAM is under a band of squalls it seems to block out any definition of the storm cell or wall cloud itself. At the time this storm passed the buoy (06 to 09z on Sept 11) it was a hurricane with sustained winds of 125 kts, gusting to 150. The center of the storm was 107 nmi off in direction 148T. At the location of the buoy the winds were 35 kts gusting to 45. We don't have much info yet, but for a storm of this size, every mile you get from its center helps. Here the 150 kts along the eye wall dropped to 35 kts at 107 nmi off, which is a good place to remind mariners to review the 'Mariners 1-2-3 Rule" and the "34-kt Rule," which are explained starting on page 44 of indispensable Mariner’s Guide For Hurricane Awareness In The North Atlantic Basin
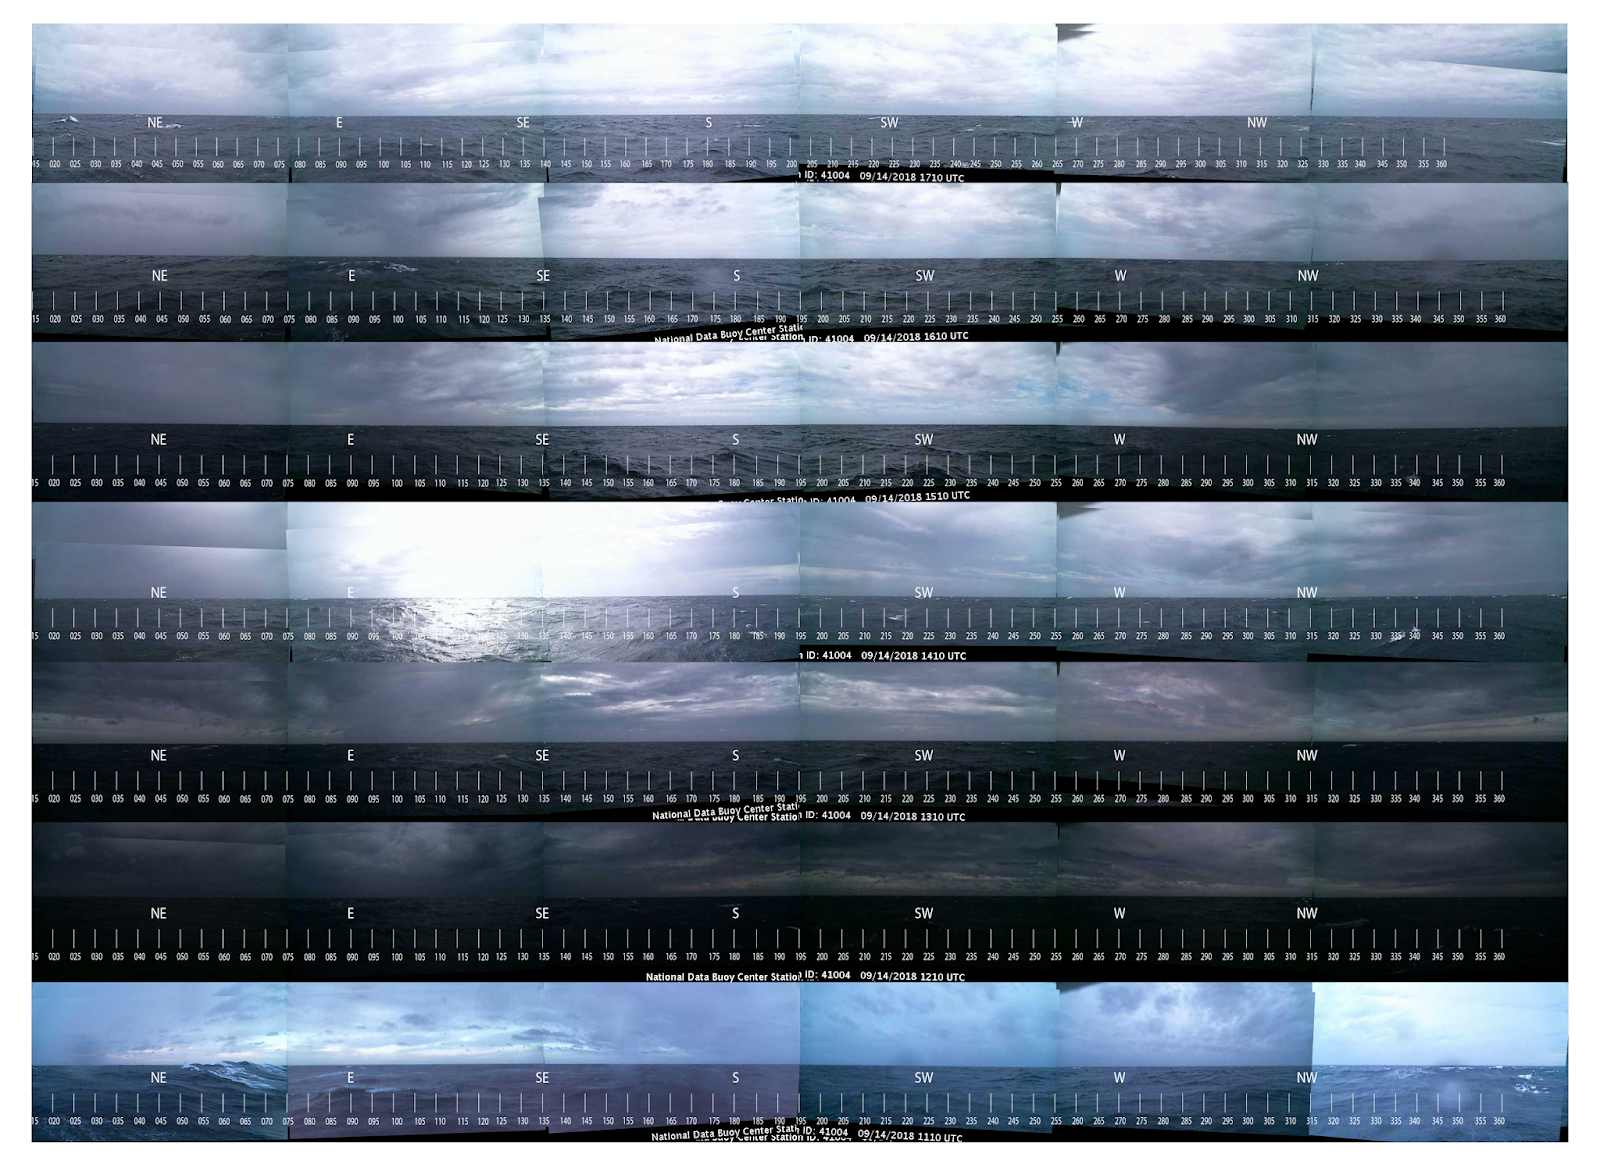
After the storm passed this buoy, it then approached another BuoyCAM, 41004. The raw data are shown below, again most recent at the top, then preceding hours below.

This is the one we ran across the camera problem. In the forth one down from the top (valid at 1410z), we can see clear indication of the sun direction. We know the location and time, so we can compute that the sun was 38º above the horizon at that time, in direction 115 T. The sun bearing on that scale would be about 231 + 60 = 291, which is north of west at a local time of about 10 AM.
We also noted that the 231 label for the left camera had not changed all day, whereas these typically swing around with the wind—they are on a buoy, on a chain. We contacted NDBC to ask about this to learn that it is now on a maintenance schedule, but it could be a while before they get to it. These buoys are not like satellites that can be remotely controlled and even repaired. A real ship has to go there and real people have to fix it. We have looked at a lot of these images from many buoys, and this is the first one we found with this error. If you want to be sure your scale is right, then it is safest to check the buoy at sunrise or sunset and compare to the true sun bearing at the time. Here is a video on how to check BuoyCAM bearings, which includes a way to get archived images, which is not documented elsewhere... sorry that it is a bit long (18m) to go over these details that might not be of interest to all readers.
How to download BuoyCAM images, present and archived, and then how to add a scale to them using a Mac. A PC version will be added shortly—the process is the same, it is just the graphics viewer programs that are different. The overlay file needed can be downloaded at
For the time being, we ignore the posted direction label shown and scale them to match the known sun direction at 1410z. We have also aligned the pictures and added a full scale, as explained in the video above.

This is consistent with the BuoyCAM (showing clear to the SW at this time) and does show that we can, on some level, imagine the mariner's perspective from the buoy. Keep in mind as well that this is dynamic. A few hours earlier this would not be the case, which is also reflected in the pics. The storm was moving W-SW at just 3 kts, but the clouds (squalls) were rotating counterclockwise.
More to the point, the storm center is to the NE at 15 to 16z. To get better perspective on that, we recenter the series of pictures above to get the following views.br />

Now we get a better feeling of what mariners might see looking around the horizon. Not only would they see clear skies to the SW, on the other side of the horizon they would see an ominous cloud to the N-NE, which we can only guess would be more impressive if we had a higher camera view. We get the best view of this at 1510z. Zooming in on 1510z, you can see under the clouds to a more prominent barrier. The center of the system was 110 nmi off at this point, and the eye diameter of this now strong tropical storm was 15 nmi.
This is some form of a "bar cloud," which can be watched to monitor its relative direction of motion. If it just grows bigger and keeps coming from that direction, the storm is headed toward us. If it moves to one side or the other, it could be going by to the side. That type of observation depends on the squalls, which come in bands, spiraling around the strom, and these could obliterate any such detailed observations. Hopefully as we get more image data in these conditions we can learn more about that type of observation.
In preparation to looking to the actual Buoy data rather than just the images, here is the full NHC Advisory 61 description issued at 9/15 at 1500z:
HURRICANE CENTER LOCATED NEAR 34.0N 78.0W AT 14/1500Z
POSITION ACCURATE WITHIN 10 NM
PRESENT MOVEMENT TOWARD THE WEST-SOUTHWEST OR 245 DEGREES AT 3 KT
ESTIMATED MINIMUM CENTRAL PRESSURE 958 MB
EYE DIAMETER 15 NM
MAX SUSTAINED WINDS 70 KT WITH GUSTS TO 85 KT.
64 KT....... 60NE 60SE 60SW 20NW.
50 KT.......100NE 80SE 80SW 40NW.
34 KT.......170NE 150SE 140SW 80NW.
12 FT SEAS..330NE 240SE 120SW 0NW.
WINDS AND SEAS VARY GREATLY IN EACH QUADRANT. RADII IN NAUTICAL
MILES ARE THE LARGEST RADII EXPECTED ANYWHERE IN THAT QUADRANT.
The buoy at this time is 110 nmi SW of storm center, which means the forecasted winds were 34 kt, a forecast that extended out to 140 nmi in this quadrant according to the Advisory. The actual winds were a bit less, 25 to 27, gusting to 35, but well within the expected variance, as clearly warned.

The above notes outline the type of study we can do watching the buoys as storms pass by. The NDBC has a series of these studies archived, which teach us much about real observations in the vicinity of tropical cyclones. Here is one of their examples showing Hurricane Rita passing over several buoys. We have used that data to confirm our "generic hurricane" we use in our textbook, Modern Marine Weather, 3rd ed. The archived NDBC results, and our own meager beginnings here on use of BuoyCAMs, are very encouraging, so we will continue to work on ways to learn more from the data.
BuoyCAMs employ the NDBC's SCOOP (Self-Contained Ocean Observing Payload) system of using several sensors in one modular unit. The images are then transferred from the buoys to NDBC via the Iridium RUDICS network. The program began in 2014/15 and is expanding still. We can look forward to even more informative images in the future as more BuoyCAMs go online with even better cameras. Think of what has happened recently with cell phone cameras to imagine the potential.
I conclude by admitting what has been in the back of my mind from the onset of our BuoyCAM studies: It is one particular picture we have had in all of our training materials, since first editions.

In the past 34 years of looking, we have not found anything at all similar to this. But just like the gold miner who keeps going back to the hills, we keep looking. There is, of course, a lot more to find besides unique images like this one.
________________
This note is now called Part 1, because new methods became available in 2019, which led to a new Part 2, which expedites this process a bit. The above basics remain crucial to interpreting the BuoyCAM images.
No comments:
Post a Comment