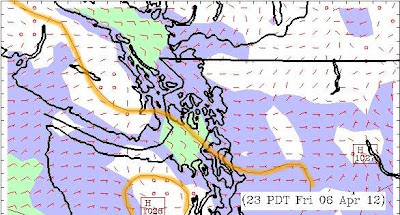
It seems the 12-km data display is a better way to read these predictions, that way we can actually see more of the race course. So here we do it all again. This is from a model initialized at 5 am PDT today, Thursday. I have highlighted the isobars bounding the race course to show how the winds are developing as they do. Recall that these isobars from the UW model should be more accurate than the ones we see in a GRIB file of the GFS model that show up on echart programs. These isobars move around a lot in this region as the day heats and cools.
Click a picture to open it, then you should be able to roll your mouse to step forward and backward through the predictions.
The follow up.
Now that the race is over, or over for most boats, we can look at how the forecasts panned out, and in short they did not. The conditions were just too squirrely. The data are below, but check out Cliff Mass's weather blog current post called "Instability in the skies" to get some insight on why conditions were so hard to forecast. The UW data did actually call for the NW winds Sat afternoon from 3 days out that was not in the early EC forecasts, but still these were very difficult forecasting conditions.


1 comment:
Observations on the actual race course throughout Friday look like the EC official forecast of just "light" was very close to the truth, and the more consistent easterlies predicted by the wrf model did not pan out. The racers are struggling along at just a few knots throughout the day, and some of these are very fast boats that do not take much wind to go faster than that.
Post a Comment