Slides and notes from a talk at Portland Yacht Club, March 11, 2017.

•
Thanks to Starpath Instructor and PYC member Larry Brandt for the invitation. I was pleased to take part and to meet so many folks at PYC. Thanks for your hospitality.
• This talk just outlines the basics. we leave details to the book below and related blog posts.
• Here is a bold but true statement: racing navigators who really want to win need to know about marine weather than any other mariner, including the shipping industry and the navy!
• ... but it takes a lot of work to gain the
advantage of just a couple knots of wind or 10º of wind angle
Here is the link to the Pacific Ocean Resources.

Two references. One on weather with emphasis of tactical weather analysis is main background; the other our new book on vector charts, which includes unique and timely information on the use of electronic navigational charts (ENC). These have many efficiency and safety advantages over the raster (RNC) charts, and are the preferred charts when doing optimized weather routing.
Amazon is cheapest source, but you get very useful PC ebooks with print book purchases at starpath.com. marine weather electronic charting
Amazon is cheapest source, but you get very useful PC ebooks with print book purchases at starpath.com. marine weather electronic charting

Oregon Offshore race has a record of about 30h, I think. Winds have been unusually favorable for the race over past couple days, with record breaking times computed in Expedition for say a Farr 40.

Note that the guys on R2AK did tremendous preparation, however, which we discuss elsewhere.
We did quick review of coastal bars. NOAA has USCG bar reports online.
Below is a sample reflecting strong recent winds:

This article explains the terms "tips" and "holes," etc, used in these bar reports.
This is important as it can show that you might not be able to stop anywhere along the way... ie the bar is closed.

Making notes for the talk, I was going to use the Umatilla Reef buoy as a waypoint, but was surprised to see it was no longer there. Clearly a good place for a buoy. I will try to find out the story on why it was removed.

A note and plug for our new book on ENC charts. They can be set to highlight specific contours, and along this route setting one at 60 ft marks the drop dead limit. This would not be used for navigation as such as it is too close in several cases, but it is a good visual on the chart to keep you in perspective to the limit. With an ENC loaded in your nav program, even if you are using an RNC on top of it, you can set alarms to warm if you are approaching a safety contour, etc.

If you can choose when to go, then the COGOW data is the best place to learn climatic wind patterns, worldwide. Bar none. This is the best data. Google COGOW or use the above link. Then play with it to see how it works. This fine work is from your own folks at Oregon State University.

The above is what we have to work with. Each item has a story and background. Most of the important links to the data are below. We must leave details to our weather book, and in particular the crucial step of evaluating the forecast will have to be referred to the book as well.

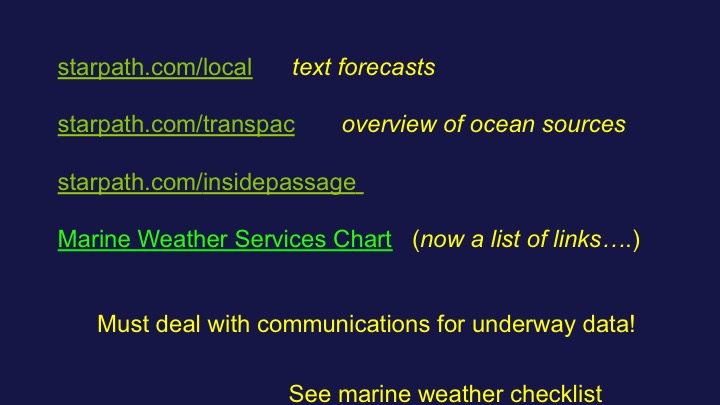
Starpath.com/transpac
Starpath.com/insidepassage
Make your own weather services chart
The check list referred to is in the first overview link, top of the article.

It is reported that Verizon has good coastal coverage along this route, but that has to be tested and not depended upon.
Sat phones cost ~1k$ and then ~1.40/min which can cover a lot of data. Iridium Go is a sat phone hotspot that wirelessly connects to phones and tablets. Data cost is lower, and other conveniences, but these two options need balanced. The Sat phone has other non maritime applications. www.ocens.net is one outlet with much details about the programs. They also have a rental program.
If you already have SSB installed and working, then that will do the job. But starting from scratch the sat phone is likely best solution. HF (SSB) radio ends up being about 5k$ install with radio, tuner, and antenna. Then you need Pactor modem, another 1.5k$ or so. Also the integrated system is somewhat more complex to run.

We made this composite from state data that is available from NOAA.
Below is a sample of a valuable document from Canada called
MARINE WEATHER GUIDE Environment Canada’s Marine Weather Services for the Pacific Coast, which is a counterpart of our marine weather services charts.
A small section is shown below. We also link to this in our www.starpath.com/insidepassage page

VHF WX reports local weather. Note that VHF WX is repeated by the USCG twice a day. Announced on ch 16 then reported on ch 22A. These reports can be head from farther offshore and also include the coastal reports.
For longer trips we benefit from a view of the full coast which we get from the high seas and coastal reports. We can get them in text when the email is working, but when all electronics fail we fall back to battery operated SW receiver. Below.

• HF times are 930
and 330 AM and PM PDT. This is standard back-up to
carry.
•
these are USCG comm frequencies, preprogrammed on all
SSB.
• NMC
all weather; WWV just storm warnings
• WWV
man's voice, WWVH woman's voice
•
call at storm warning times to hear these
• Easier
to get these broadcasted reports by txt from saildocs email. (see later, below)

short video below demoing dial a buoy

This is an interactive graphic index to all weather maps plus automated way to send an email request to saildocs to get a compressed version sent to you by email.
Read about this free service and download the interactive pdf from Starpath Briefings.
* * *
Moving on to "GRIB data"...

This is a summary of the regional weather model data. Read about these here: GRIB-formatted Region Wind Forecasts. Samples of these and further discussion is included in the article: Sailboat Racing in the Salish Sea. We give links to the his res UW WRF data at www.starpath.com/local
www.saildocs.com is the primary source of wx data by email request. It is fundamental to know about this source. They offer text, maps, and GRIB files.

Info on Saildocs Grib file requests (ie the link above)

www.sailflow.com shows present hr of HRRR data free online, but you can see all 18 hr of data on the Predict wind app for iOS or Android. A really valuable app for every sailor's phone. We can get HRRR data from saildocs. Mac users can also get HRRR in the excellent GRIB viewer from www.LuckGrib.com

Pointing out the difference in data resolution. Note all GRIB viewers interpolate the data, so you may see more wind arrows than are real. In the above right (from LuckGrib) the real data points are the ones with the small dots, at the corners of the red box.

Expedition from www.expeditionmarine.com is the top of the line program for sailing performance measurement and analysis and optimal weather routing taking into account the boats polar diagrams, including both wind and wave polars, and indeed, sets of these polars for various conditions. Ocean and tidal currents are also incorporated into the optimizations.
An inshore or coastal route would use GRIB files for HRRR wind (updated hourly and extending out 18h), currents tidal and ocean/coastal. the latter being from HYCOM or RTOFS model, or maybe OSCAR. And wave data from say WW3 model, or maybe better data from the DWD (Deutscher Wetterdienst) whose wave and swell data are now available from www.LuckGrib.com — this Mac app costs $20 and is state of the art in stand alone GRIB viewers and offers the broadest range of GRIB files including ASCAT scatterometer data in GRIB format. Even if you are using Expedition for routing, you can get unique data from LuckGrib and then export it to use in Expedition or other programs.

Here is an example of RTOFS forecast of an unusual patch of 1+ kts of current off the coast. Such patterns would have to be double checked before incorporating into the routing. Compare with other models and ideally if you have HF Radar current data available, check it.
We have a page about currents at www.starpath.com/currents... though parts of it are out of date. Read about these "loose cannon" meso-scale current eddies there. Also neat video link there on global currents and eddies.
When weather routing or navigating underway, we want to know of any such prediction of the current, but we cannot count on it being precise or even correct! The job is know a pattern is predicted and then watch instruments carefully to see if you detect it.... if favorable, might even alter course a bit to look for it. But if no evidence shows up, then take it out of the routing. How we handle such things in places like the Gulf Stream is crucial.
In times when your waters are dominated by nearby tropical storms (ie both Vic Maui and Pac Cup last year), which can create large and confusing swell patterns, then it could be equally crucial to be treating the swells properly, and this will take good "wave polars" to execute. With strong wind opposing strong current, then the waves and currents become crucial to the routing.
You can also test wave and swell data by comparing models with offshore buoys that report these.
The ocean and coastal wind models can also be tested with the GRIB ASCAT data. View graphic ASCAT data online at the Ocean Surface Winds Team web site (google ASCAT)

Unfortunately we do not have HF Radar current data north of Astoria, but in many other areas of the coast this is crucial to checking the models that we use in the routing. The link above is to COASTAL OBSERVING RESEARCH AND DEVELOPMENT CENTER, who coordinates this program.
* * *
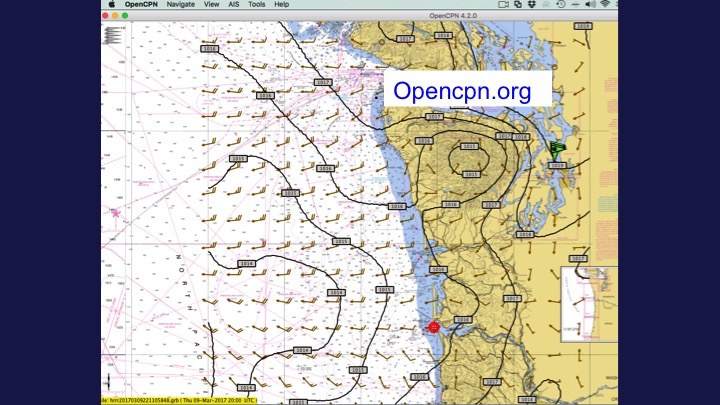
We need some way to display the GRIB data. Mac users have www.LuckGrib.com, which for stand alone viewing and display options is unsurpassed. PC users have many options, from the completely free www.opencpn.org on up to the premier routing program www.expeditionmarine.com.
Opencpn is an excellent way to get into electronic chart navigation in the first place. It also has excellent plugins for downloading and displaying GRIB data from Saildocs. And it also has a basic sailboat routing plugin using your own polars.
For general echart navigation, the Rose Point Coastal Explorer is a popular choice with very convenient chart loading and navigation operations, and it also can download saildocs data or show data you get from other sources.
I end with another recommendation for our new book on Electronic Chart Navigation. It does not address weather per se, but does discuss the display of GRIB files. It mainly explains the great value of using the vector charts for your general navigation, keeping in mind that the weather routing functions are generally done more efficiently with vector charts rather than raster charts, which means to do the best weather routing in the end we need to know as much as we can about the vector charts.
No comments:
Post a Comment