These storms may be getting more severe on average, and maybe wandering off to higher latitudes more often, we have not checked that. All we did is compare what Bowditch reported in 1977 compared to what they report in the brand new 2017 edition as to the total number of systems. In 1977 there were not many convenient sources of this data. Now we have all the detail we could ever want about every system, and we get it directly from the primary sources, but it is not clear that the new Bowditch data might need updated itself.
The statistics shown below are all data up to 1977 compared with the latest systematic study in the 2017 Bowditch, described as 1981 to 2010. You can click the pic for better view.

The values are average number of incidents per month. "S" is number of tropical storms, meaning sustained (> 1 minute) winds ≥ 34 kts. "H" is number of hurricane-force systems, also sustained.
Note that the storms include the hurricanes... all hurricanes start out as storms. So of the 12.1 storms per year average in the North Atlantic, only 6.4 of these on average proceeded to become hurricanes. (If you happen to look at the 1977 Bowditch data, they used a different convention on presenting this information; we regrouped that early data to make this comparison.)
The North Atlantic region (including Caribbean and Gulf of Mexico) definitely has more storms (we have about 29% higher chance of seeing storm force winds), but there is a slightly lower chance according to this data that these become hurricanes—but this still leaves us with slightly more hurricanes than earlier, about 20%.
But these are statistics. We could have 10 hurricanes this year (as we did), then 2 the next year, and we are back on the average of 6. The question is, how likely is that, just 2? If we have 10 next year as well, we better have zero the next year, just to approach the average. In short it could be that these Bowditch stats need to include more recent data, ie 2011 to 2017.
For example, here are the recent data from the NHC.
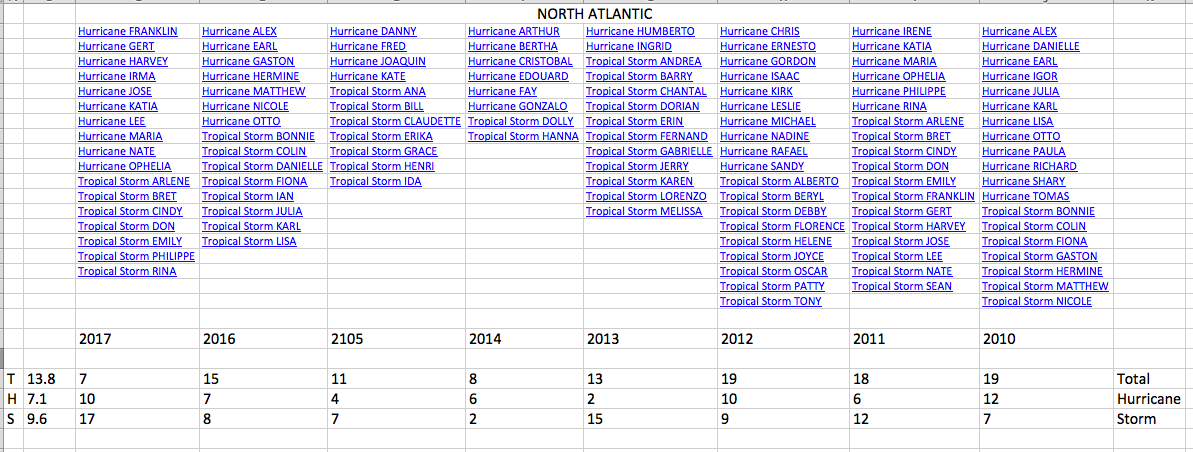
For the North Atlantic, over the past 7 years (not included in Bowditch 2017) we see 13.8 and 7.1, which is higher than 12.1 and 6.4, but not that much.

Over the past 7 years we see higher numbers for East Pacific: 15.9 and 9.4 compared to 16.6 and 8.9, which is about the same... but both notably higher hurricanes than in 1977 (15.2 and 5.8).
With our check of the recent data we can compute the standard deviations (SD), which are:
East Pacific: 15.9 ( 4.6) and 9.4 (3.0)
North Atlantic: 13.8 (4.8) and 7.1 (3.4)
We do not have a lot of data here, but these are large SDs, which means we can expect large variations of these numbers from year to year. Below is the distribution of events if the variation is indeed random.

This means that 68% of the values should be within 1 SD of the mean, or we can look at it as shown below

With, say, 7 hurricanes per year with an SD of 3 it means that there is only roughly 16% chance of having 4, or put the other way, there is also a 16% chance of having 10, but if we have 13 events (2 SD above the average) then we are down to 2.3% chance by random, which raises more the issue of looking toward trends. It would be nice if we had the SD for the 2017 Bowditch data. That was not given in the book, but it is fairly easy to look up the actual values and compute it as we did here.
Without an in depth analysis, it seems we can likely rely on the numbers in 2017 Bowditch values, with the awareness that these do appear to be rising slightly still, beyond that 2010 data sample. Other notable changes can be seen in the other zones.
It is likely a more interesting study for climatologists to look at severity, but this has little interest to mariners, i.e., we would obviously treat a 150 kts forecast the same as we would a 115 kts... but we might want to keep an eye on storm size. With all the data that is available, one could do a very precise study as a home project on, say, the average area covered by 34-kt winds from inception up to hurricane strength, and then the area covered by 50-64 kts and then >64 kt winds after that.
The other study would be how far north do they go, and indeed how long do they last. If you have a student with a science project on the horizon, this is very easy data to get online and the analysis would be a good exercise in using numbers. Furthermore, this has much value to mariners and we cannot count on anyone without a maritime interest in putting these specific values together. (If a student is interested they can call us and we will help.)
Check out the 2017 Bowditch, Chapter 39. They have very good coverage of tropical systems, that even include QR-codes to go directly to the various Regional Specialized Meteorological Centers (RSMC) that do the job of our National Hurricane Center for other tropical cyclone zones.
If you plan to be sailing in a hurricane zone, a mandatory reference is:
Noting especially the Mariners 34-kt Rule and the Mariners 1-2-3 rule on storm track uncertainty. I would also like to think that our own book would be helpful
Here is a sample of the 2017 Bowditch's extensive use of QR-codes, which is pretty techy, but all the links in the pdf are interactive in the first place.

No comments:
Post a Comment