We did this analysis in 2008 and just rediscovered it. We will come back shortly and analyze a few of the pictures. The effect is clear without actual numbers, but I will add some numbers in the next day or so to compare with the predictions.
There are many factors that can cause the observed tide height to differ from the predicted tide heights found in tide books. Atmospheric pressure studied here is only one, and in many circumstances or regions this is not the most important effect. Wind speed and direction creating unaccounted for wind-driven currents is another factor, as is unseasonable river runoff.
There are many factors that can cause the observed tide height to differ from the predicted tide heights found in tide books. Atmospheric pressure studied here is only one, and in many circumstances or regions this is not the most important effect. Wind speed and direction creating unaccounted for wind-driven currents is another factor, as is unseasonable river runoff.
The effect of atmospheric pressure on water level is called the inverse barometer effect (IBE). Pressure is just the weight of the air above us, so when the pressure is higher than normal, the rising tide has more air to lift and so it cannot lift it quite as high as in normal conditions. When the pressure is lower than normal, the tide rises higher than predicted, because is has less air to raise than was anticipated.
We show here that this effect can be observed and anticipated in at least one tide station in Puget Sound, Cherry Point, near Edmonds, WA. The theoretical magnitude of the effect is about 1 cm of tide height for each 1 mb of pressure difference from the seasonal mean.
The effect was known in the 1800s, often stated as "Fog nips the tide" — which was almost right. It is not the fog, however, but the high pressure that usually accompanies the fog that is doing the nipping.
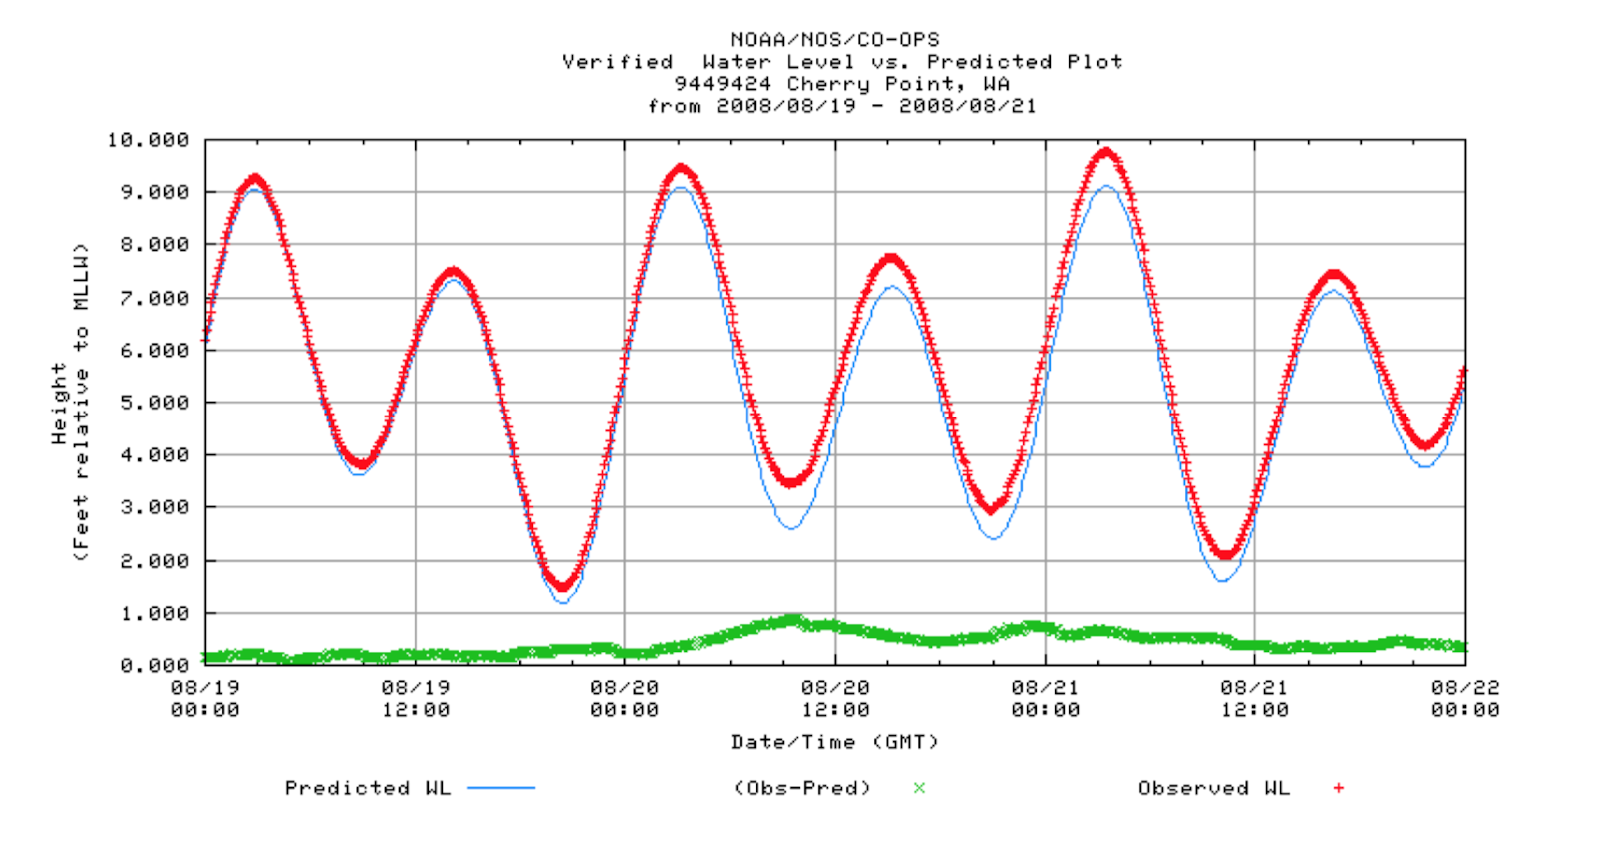
In the data presented we see both the rise in tide height in lower than normal pressure, as well as the lowering of tide height in higher than normal pressures. This simple theory accounts for the observations quite well, considering the large uncertainties of the model.
The mean surface pressure in Puget Sound is about 1017 ± 1mb throughout the year. So we have looked at pressure incidents that exceed the mean by ± 13 mb. The standard deviation of the mean in Puget Sound is about 5 mb in the summer (June, July) and about 11 mb in the winter (Dec, Jan). The dates covered are Jan 1 to Oct 26, 2008. All incidents that meet these pressure criteria are included.
The IBE is discussed in The Barometer Handbook See also the long list of related articles on barometry at the support link for that book.
Below we show the data in Part I for all 2008 incidents of pressures above 1030 mb at Cherry Pt, Puget Sound, and in Part II, all 2008 incidents of pressures below 1004 mb at Cherry Pt, Puget Sound. The data are from http://tidesandcurrents.noaa.gov.
Part I High Pressures, above 1030 mb


Part 2. Low Pressures, below 1004 mb


No comments:
Post a Comment