Before the start any data available are legal, but after the start only free public data are legal. We compare here a couple numerical predictions using Buoy 46026, located 18 mi west of San Francisco, of interest, for example, for the start of the Pacific Cup, San Francisco to Kaneoe Bay, Oahu.
Here is the data from Buoy 46026 followed by several numerical forecasts. [When this post first went up, these were embedded links that updated automatically so we could follow the forecasts. Now we have replaced these with the complied data up till July 11, and these are static.]
We are basically testing here the forecasts made at 18z on July 7 to see how they pan out for a day or so, with a main goal to simply illustrate one way to test models when preparing for a race.

 |
| These are both pictures captured from the NDBC site for Buoy 46026. |
So the procedure is, look at the wind speed and direction from the auto-updated pictures above and then look below to see how the models forecasted that back at 18z on Jul 7.
GFS at 28 km (0.25º) goes out >96h at 3h steps, updated every 6h
HRRR only goes out 15h at 1h steps, updated every hour
 |
| HRRR ony goes hour 15h, so very good for that period, but then need something longer. |
NAM

NDFD every 6h, 3h steps, 3 km, out

PW-GFS every 6h, 1h steps,

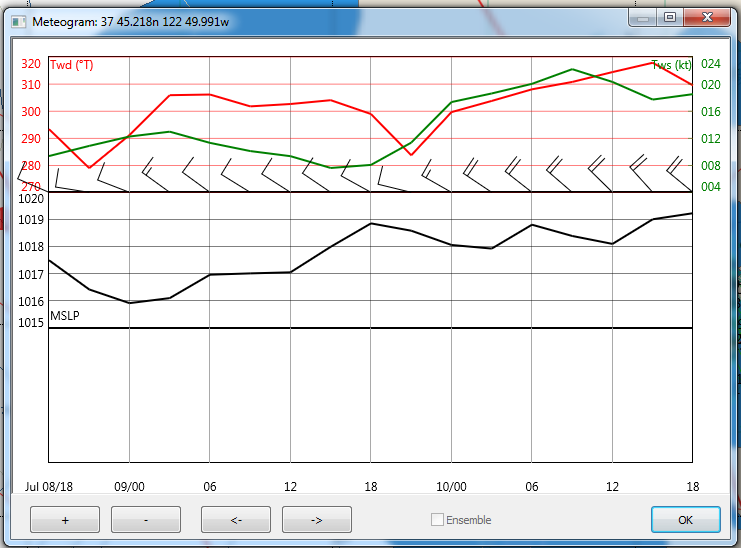
Note that several models call for 20 kts by 02 to 08z July 10, so it will be interesting to see who has this the closest... [Note added 7/1; we see the wind did indeed go to 20 kts at about the right time, though a bit later earlier or later than some predicted—but these are the details one might want to evaluate. We did not know this at the time of the original post at 18z, July 7.]
The hi res regional models do not go out far enough to see this back at 18z on the 7th. They are intended to be run more frequently.
Apply this for other cases you might care about. You can look at a buoy of your choice in the waters you care about at the NDBC site, and then load the various models in Expedition and just plot a meteogram at the buoy location and watch how the forecast pans out.
Note that you can check buoy data directly by sending this to query@saildocs.com
send http://www.ndbc.noaa.gov/mini_station_page.php?station=46026
Find buoy IDs at the ndbc site.
...and you will get back the data below, from which we see the models are pretty good, but NAM and GFS are off more than the others, and HRRR has timed out.
Station 46026
37.755 N 122.839 W8:50 pm PDT 07/08/16
0350 GMT 07/09/16
Wind: WNW (300°), 11.7 kt
Gust: 13.6 kt
Seas: 3.3 ft
Peak Period: 12 sec
Pres: 30.03 steady
Air Temp: 56.8 °F
Water Temp: 56.3 °F
Wave Summary
9:00 pm PDT 07/08/16
0400 GMT 07/09/16
Swell: 2.6 ft
Period: 12.1 sec
Direction: SSE
Wind Wave: 2.0 ft
Period: 4.2 sec
Direction: WNW
Enter a station ID:
Or you can subscribe to that and get it back every hour, or 3h etc. Best to check with saildocs on that procdure.
No comments:
Post a Comment