Electronic navigational charts (ENC) are not at all new to navigation. They have been in use by commercial vessels for over 20 years, but they have not really caught on much with recreational mariners. This is in part because they look different from paper charts, but also largely because their presentation on the screen and how users interact with them is so different from the use of raster navigational charts (RNC), which are static images of the paper charts.
One of the things that is notably different with ENC is when you zoom out on the chart, the chart symbols and text labels do not change size. They can do this because ENC are all vector products and they just redraw everything at each new scale, and this keeps the symbols and text in view
That is, unless you happen to be zooming out on a region that has a lot of symbols. Zoomed in they are far apart on the screen but zoomed out they pile up to the point of becoming totally unreadable.
Above is a sample of a cluttered screen with SCAMIN not engaged. In ENC terminology, this is
Display mode All, which means show all objects. This chart is actually over-zoomed in on a very small scale chart.... all new terms we need to look into here.
There are several ways to clean this up.

We don't want to go this far, leaving just water and rocks, but there are many levels in between, which we can set up depending on our navigation needs. This is
Display mode Base, which is the minimum objects possible.
The ENC and their presentation rules address the issue of cluttered displays by assigning to each charted object an attribute called "Scale minimum," which has an abbreviation SCAMIN. But to pursue that idea, we need more terminology.
All paper charts have a well-known properly called its chart scale. A scale of 1:40,000, for example, means that 1 inch on the paper chart is equivalent to 40,000 inches (0.55 nmi) on the ground or water being represented. On a 1:80,000 chart, 1 inch would be 80,000 inches, about 1 nmi per inch, and so on.
That is a plain enough concept, but we can make this more complicated!
Chart scales are described as large scale or small scale based on thinking of the scale as a fraction: 1/20,000 is a larger number than 1/40,000 which in turn is larger than 1/80,000. Thus we call 1:10,000 or 1:20,000 large scale charts, whereas 1:80,000 or 1:150,000 are small scale charts. Studying traditional navigation we slowly become used to that, and we could arrange our stack of paper charts in order of increasing or decreasing chart scale as we might choose.
But any one paper chart only has one scale, and it never changes. When we view a chart in a computer, where we can zoom in and out on the display, we are changing its scale each time we change the zoom. So we need new terms.
A specific ENC is almost always based on a specific paper chart (RNC), or predominately on one, which has a unique scale, and that original scale used to make the ENC is called its compilation scale. We can ask an ENC for its chart properties, and it will report back a scale, which is its compilation scale. The ENC US5WA16M, for example, is based on paper chart 18471 which has a scale of 1:40,000 so the ENC has a compilation scale of 1:40,000. (This relationship between paper chart scales and ENC scales will eventually change with NOAA's ongoing rescheming program, but that is the way most ENC are for now.)
Viewing this ENC on a computer screen, we can zoom in and out, ending up with various scales. The scale we happen to be looking at is called the display scale. Nav programs let us view this scale on the screen as we zoom in and out. The display scale can be larger or smaller than the compilation scale. In principle, the scale shown has the same meaning we are used to with paper charts. Namely viewing a chart at a display scale of 1:44,882 should mean that 1 inch on the screen is 44,882 inches on the charted ground. Some programs are fairly good at this, others less so. It is an easy thing to check comparing with the RNC of the same area.
In principle, any one ENC is intended to be viewed at the compilation scale for crucial navigation, with the obvious knowledge that the user is going to zoom in and out to meet their needs. Keeping in mind that the scale names "go backwards" in a sense, the table below reminds us what zooming means.
When we zoom in we are going to larger scales, and land in view will get larger as we do so, but the actual scale values will be getting smaller.
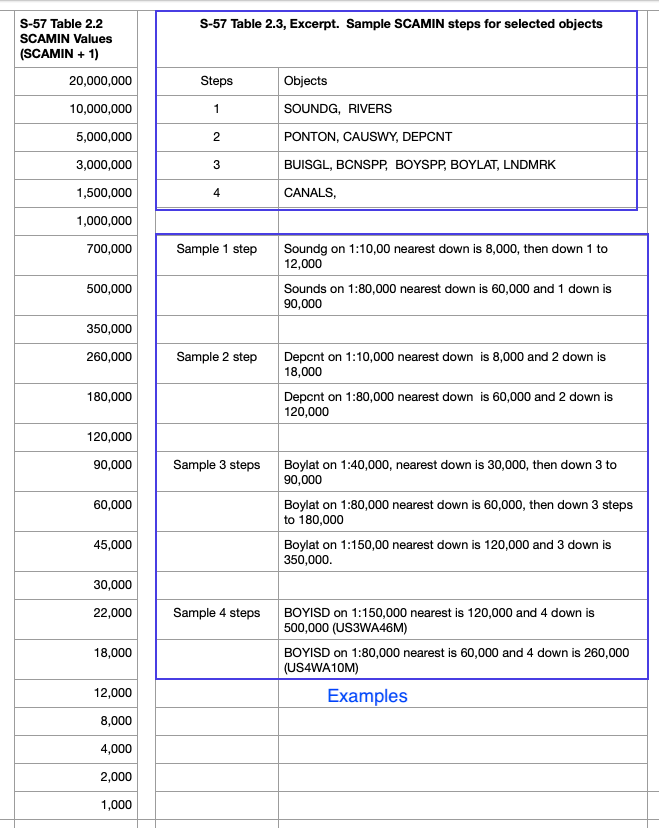
With this background we can now look at a unique property of all ENC objects. They each have an attribute called Scale minimum abbreviated SCAMIN. SCAMIN is the minimum display scale that will show a specific object on a specific chart. Below are a few samples of how SCAMIN values can change with chart scale.
Charts in the top two groups have overlapping coverage of at least one of the objects listed; the bottom group are adjacent and overlapping charts.
If you are viewing the chart at a display scale equal to the compilation scale, and you zoom out from there in steps (going to larger scale numbers), then at some point the object you are looking at will disappear. This happens when your display scale equals the SCAMIN value.
The diagram shows SCAMIN + 1, because the SCAMIN values are encoded in the ENC as 1 less than a common chart scale. Thus we do not see SCAMIN = 1:12,000; we would see SCAMIN = 1:11,999. This is presumably done to prevent rounding errors at the transitions. We have just undone this here for clarity.
Thus SCAMIN has a couple effects on our practical navigation. Zooming out, it keeps the charts from getting too cluttered by removing objects we might not be looking for on smaller scales, but in doing so, it might well be hiding an object we are looking for. Thus we have to be mindful of SCAMIN values and how they work. It is called "scale minimum," which means the smallest scale it shows on, which we have to recall means the largest "scale number" it will show on.
Plus there are several subtitles we have to be on the lookout for. A lighthouse might on one chart be called a Landmark (LNDMRK) and on another chart be called a Single building (BUISGL). Recall that on ENC, we do not have lighthouses, we have LIGHTS and we have objects (LNDMRK or BUISGL) whose FUNCTN attribute is Light support. On a 1:10,000 chart, the former is in view all the way to 1:22,000, where things are half the size they are compilation scale, but the latter goes away at 1:12,000, where these same things have only diminished in size by 10 or 20%. Depending on your nav program and how you have it set up, starting from the compilation scale, the former is in view for 10 steps of zoom, whereas the latter goes away in one step.
Another issue comes up when two adjacent or overlapping charts have notably different SCAMIN for the same object. Then you can see an object bounce in and out of view as you change charts.
In extreme cases, if you ignore all the many safety features built into an ENC and a good nav program or ECDIS, then you could in principle view a chart at the compilation scale and then zoom out enough to hide a dangerous sounding and then navigating on that scale you hit it. There are articles online about ships doing that, but you have to do so many things wrong to get to that point that this is not a serious concern. The use of ENC safety contours and alarm-triggering COG predictors will prevent this, not to mention going over a planned route carefully once set up, which is standard procedure.
___________________
So with SCAMIN we see that zooming out from the compilation scale by something like a factor of two or so (i.e., going from 1:40,000 to 1:80,000) can remove objects from view. This is sometimes called "under zooming."
Going the other direction, zooming in from the compilation scale by a factor of two or more (i.e., going from 1:40,000 to 1:20,000) is called "over zooming," and this has its consequences as well, although it is not uncommon to do so with caution in routine navigation. The primary consequence is we risk displaying chart details at a level that is beyond their actual accuracy. Because of that, nav programs have various ways to alert mariners to an over zoomed chart, usually with a prominent announcement on the screen.
Type approved ECDIS cover an over-zoomed chart with a grid of parallel lines, but this is considered more than needed by most unofficial electronic charting systems (ECS). We have notes elsewhere on over zooming as well as how we tell what the base accuracy of the charted objects is to begin with.
___________________
For completeness, we add here the complex way that the IHO recommends the choice of SCAMIN based on compilation scale and specific object. They publish a Table 2.2 that lists the only values that a SCAMIN can be. Then there is a Table 2.3 that lists all objects along with the steps down in scale within that table to find the right SCAMIN to use. If the compilation scale of the chart is not on Table 2.2, then start with the one that is just below it.
Along with that we have a few examples of how this works, keeping in mind that many objects also have more rules that govern the recommended SCAMIN values. I selected examples without extra rules.
Recall that going down to a smaller scale means to a larger number, and "3 steps down" in scale on this table means going up the list! We see that all the examples looked at follow the prescribed rules.
SCAMIN and Rescheming
Rescheming is NOAA speak for improving the ENC format, standardizing chart shapes and sizes, as well as contours and scales. We know from above that SCAMIN values depend on chart scale, so when the scale changes, so does the SCAMIN values. Dividing up a 1:80,000 region into a series of 1:20,000 is a common transition, which would make buoys (at 3 steps in the table go from SCAMIN of 179,999 to 44,999, which is just what we see in these samples from Galveston Bay, where both charts are still available.
Below we see these daymark beacons with their new SCAMIN on the reschemed charts. In the bottom chart, we see the new (1:20,000) reschemed charts outlined in red, because the they are totally covered by the legacy (1:80,000) chart. The blue lines mark boundaries of adjacent, same-scale charts.


No comments:
Post a Comment