One of the things we miss the most in using ENC is the essential absence of terrain info, especially elevation contours, buildings, and streets we can see from the water. There are occasional spot elevations on ENC, and even more rarely a cliff, but not much more.... and I should add here that some nations do a better job on the land than we do. But it is generally not as good as we are used to with paper charts, and the sad part is, it could indeed be very much better—I am optimistic that the new NOAA Custom Charts (NCC) will make up for this, eventually.
A hint in that direction is the qtVlm function that lets us overlay shape files on the charts we are looking at, be they ENC or RNC.
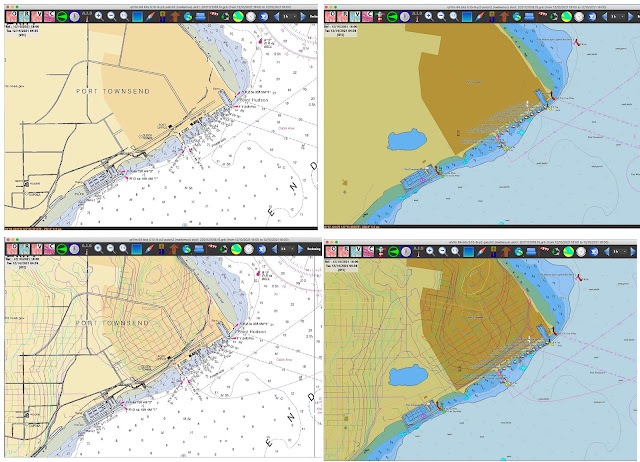
For an enhanced view, right click, open in new tab, then zoom in.
My main goal here is to show how to get this contour data; once that is done, loading it into qtVlm is quick and easy. The process is not hard once you know the sequence. We are going for elevation contours over US lands.
How to get elevation contours
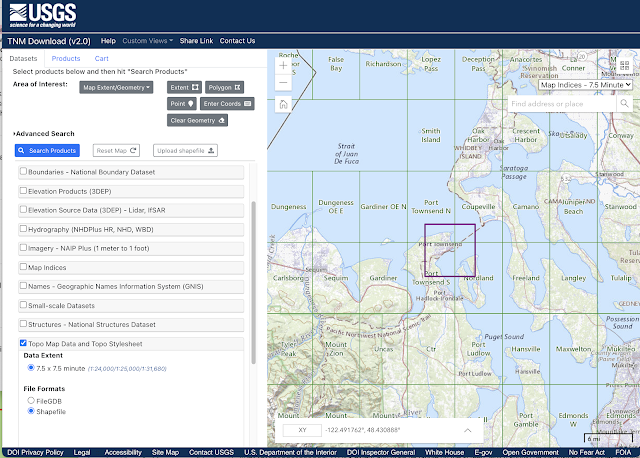
Step 1. Go to https://apps.nationalmap.gov/downloader/
Step 2. Pan and zoom the map to the area you care about (it has a fast, positive response)
Step 3. On the top right, choose map indices = 7.5 minute, and it will draw in the areas we can select this way. (There are ways to get larger sections at a time, up to 1ºx1º but those contour files will be 200-300MB, which are too big to load at one time. They load, but slows the program down and we never need this all at once. )
Step 4. Scroll the left side menu to the bottom section and check: "Topo map data and topo style sheets."
Step 5. Check 7.5’ x 7.5’ and check Shapefile.
Step 6. At the top left Set Area of interest = Mat Extent/Geometry, then click Extent, then on the map draw a rectangle inside of what you want. Don't encompass it, but rather just have the border inside of the ones you want. (The choice will be 1, 2 or 4 or more tiles, but we do not need to download all we select. You can also "clear Geometry and start again.)
Step 7. Back to the top left then choose Search products, and you will get a list of all the files you can download. The link is on the bottom. Note that each tile has a name.
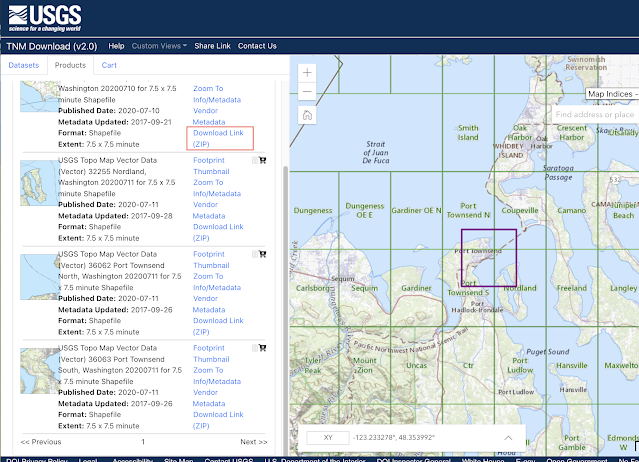
Step 8. You will get a file such as: VECTOR_Nordland_WA_7_5_Min_Shape.zip. When you unzip that you get a folder called Shape that contains 180 files. We need then to pull out just the ones called Elev_Contour

Step 9. Copy these into a new folder named, say, Nordland_contours. You can then load these into qtVlm using menu View/Shapefiles and SHOM/Open a shapefile (SHOM is the French Hydrographic Office). In this process you direct the program to the main SHP file, but the program also needs others in this set. You can then add multiple such files, keeping the data sets in separate folders on your computer.
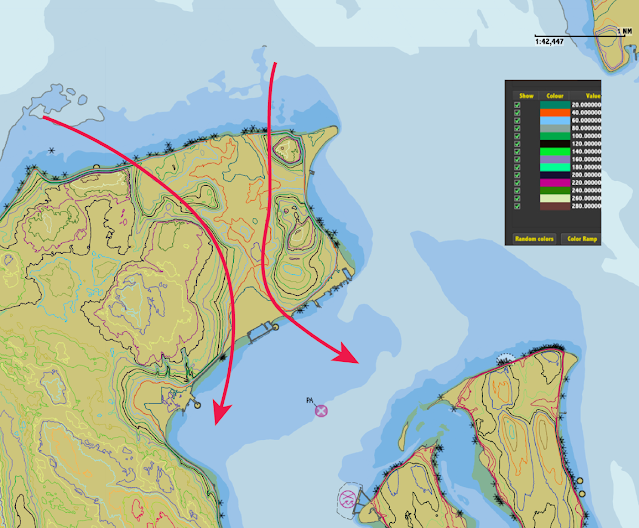
Here is a quick look at elevation contours over Port Townsend area—not optimized in display, with just random colors used. But we see already something we could not see on the RNC or the ENC, namely there is a pronounced channel on the peninsula that is only 20 to 40 ft high bordered by 160 to 200 ft high hills. This can funnel in winds creating notable wind lines at the boundaries shown here that are indeed known to local racers, which our lead weather instructor Dave Wilkinson can vouch for. He knows these waters well. Elevation contours and spot elevations on nautical charts are referenced to mean sea level, unlike the heights of lights and bridge clearances which are relative to MHW.
The video below illustrates the procedures above plus then loading them into qtVlm.
No comments:
Post a Comment